- The Option Premium
- Posts
- The Pre-Earnings IV Crush Trade: Selling Volatility Before the Announcement
The Pre-Earnings IV Crush Trade: Selling Volatility Before the Announcement
IV overestimates earnings moves by 15-20%. Learn to sell inflated premium 1-3 days before announcements using iron condors placed outside the expected move, with 6 risk rules for binary events.

Andrew Crowder
April 04, 2026

The Pre-Earnings IV Crush Trade: Selling Volatility Before the Announcement
Every earnings season, the same pattern repeats. Implied volatility climbs steadily in the weeks before an announcement as traders buy options to position for the move. Then, the moment earnings are released, IV collapses, often by 30-60% overnight, regardless of whether the stock goes up or down. This is the IV crush, and it's one of the most predictable, repeatable phenomena in options trading.
Premium sellers who understand this pattern can position before the announcement, collect inflated premium, and profit from the collapse in volatility itself, not from predicting the direction of the stock. The trade doesn't require you to guess whether earnings will be good or bad. It requires you to understand that options are overpriced before the event and will reprice immediately after.
This guide covers the mechanics of why IV inflates before earnings, the specific trade structures that profit from the crush, and the risk management framework that keeps this trade from becoming a gamble.
Why Implied Volatility Inflates Before Earnings
Implied volatility reflects the market's expectation of future price movement. Before an earnings announcement, uncertainty is at its peak. Traders don't know whether revenue beat estimates, whether guidance was raised or lowered, or whether the CEO announced a restructuring. That uncertainty gets priced into options as elevated IV.
The supply and demand dynamic is straightforward. Speculators buy calls hoping for a pop. Hedgers buy puts to protect existing positions. Both actions increase demand for options, which drives up premiums. Market makers respond by widening the implied volatility component of their pricing. The result: options on a stock like AAPL might trade at 25% IV three weeks before earnings, then climb to 40-45% IV the day before the announcement.
This IV inflation is systematic, not random. Research consistently shows that implied volatility overestimates the actual post-earnings move. A study of S&P 500 stocks found that implied volatility before earnings overstated the realized move by an average of 15-20%. This gap, the earnings volatility risk premium, is the edge that pre-earnings sellers exploit.
The crush happens because uncertainty resolves instantly. The moment earnings are released (typically after market close or before market open), the unknown becomes known. Guidance is published. Revenue is reported. The uncertainty that was priced into IV disappears in seconds, and IV drops to reflect the new (much lower) level of uncertainty. A stock trading at 45% IV before earnings might open the next morning at 22% IV. That 23-point drop in IV translates directly into lower option prices, which is profit for the seller.
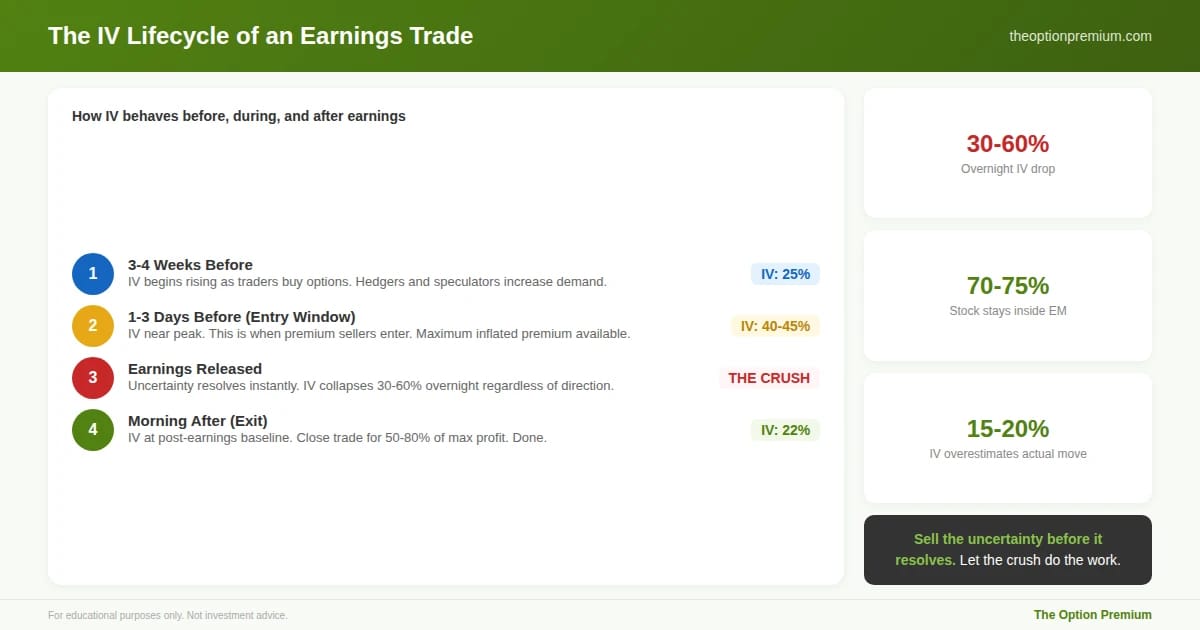
The IV lifecycle of an earnings trade follows the same four phases every quarter. Phase 1: IV begins rising 3-4 weeks out as traders buy options for positioning. Phase 2: IV reaches peak 1-3 days before the announcement, which is when premium sellers enter. Phase 3: earnings release, uncertainty resolves instantly, and IV crushes 30-60% overnight regardless of direction. Phase 4: the morning after, IV is at post-earnings baseline and you close for 50-80% of max profit. The entire trade lifecycle is 2-4 days.
The Expected Move: Your Framework for Strike Placement
The expected move for earnings is derived from the at-the-money straddle price on the expiration closest to the announcement date. It tells you how far the market expects the stock to move in response to earnings.
How to calculate it. Find the ATM straddle price for the weekly expiration that includes the earnings date. If AAPL is at $230 and the ATM straddle (call + put at the $230 strike) is priced at $12.00, the expected move is approximately $12.00, or 5.2%. The market expects AAPL to be somewhere between $218 and $242 after the announcement.
Why this matters for strike selection. If you sell a credit spread or iron condor with short strikes outside the expected move, you're betting that the stock moves less than the market expects. And historically, stocks move less than the expected move roughly 70-75% of the time. That's your structural edge.
Place your short strikes at 1.0-1.25x the expected move. On the AAPL example: expected move is $12.00. At 1.0x, your short put is at $218 and short call at $242. At 1.25x, short put at $215, short call at $245. The wider placement reduces premium collected but increases win rate. The tighter placement collects more but brings the strikes closer to the expected range.
Three Trade Structures for Earnings IV Crush
Structure 1: The Short Strangle (Undefined Risk, Experienced Traders Only)
Sell an OTM put and an OTM call outside the expected move. This collects the most premium and benefits fully from the IV crush. The risk is undefined: if the stock makes a massive move (think 15%+ gap), losses can be substantial.
Example: AAPL at $230. Sell the $215 put and $245 call for $3.50 combined credit. If AAPL opens anywhere between $215 and $245 (the expected move range), both options lose most of their value overnight as IV crushes. Even if AAPL moves to $220 (a $10 drop), the IV crush may reduce the put's value enough that the trade is still profitable.
Best for: Experienced traders with margin accounts who can handle undefined risk. Requires strict position sizing.
Structure 2: The Iron Condor (Defined Risk, Most Common)
Sell an iron condor with short strikes outside the expected move and long strikes further out for protection. This defines your maximum loss while still profiting from the IV crush.
Example: AAPL at $230. Sell the $215/$210 put spread and $245/$250 call spread for $1.80 combined credit. Max loss: $3.20 per side. If AAPL stays between $215 and $245, the IV crush does most of the work. The entire condor might be worth $0.40 the morning after earnings, giving you $1.40 profit on $3.20 risk (43.8% ROC).
Best for: Most premium sellers. Defined risk. Clear max loss for sizing purposes.
Structure 3: The Short Put Spread (Directional Lean)
If you have a bullish bias on the underlying, sell only the put spread below the expected move. You're still selling inflated IV, but you're not exposed to the upside. This works well on stocks with a history of positive earnings reactions.
Example: AAPL at $230. Sell the $215/$210 put spread for $1.10. Max loss: $3.90. If AAPL drops less than the expected move (stays above $215), the IV crush makes the spread nearly worthless overnight.
Best for: Traders with a directional view who still want to exploit the IV crush

Three ways to trade the earnings IV crush, each suited to different risk tolerances. The short strangle collects the most premium ($3.50) but has undefined risk. The iron condor is the recommended structure for most traders: $1.80 credit, $3.20 max risk, 43.8% ROC if profitable, and completely defined risk. The short put spread ($1.10 credit) works when you have a bullish lean and want IV crush exposure on one side only. All three use strikes outside AAPL's $12 expected move.
The Entry Timing: When to Sell
The sweet spot is 1-5 days before the earnings announcement. This is when IV is at or near its peak. Selling too early (2-3 weeks before) means you collect lower IV and your capital is committed longer. Selling the day of the announcement captures peak IV but gives you zero time to adjust if the stock moves before the close.
My default: enter 1-3 days before earnings. This captures 85-95% of the peak IV inflation while giving me a small window to evaluate whether anything has changed (pre-announcement guidance revisions, sector moves, etc.).
Use IV Percentile as confirmation. Before entering a pre-earnings trade, check that IV Percentile is above 50% (ideally above 70%). This confirms that current IV is elevated relative to its historical range. If IVP is below 50% even with earnings approaching, the IV crush may not be significant enough to justify the trade.
Check the VVIX and volatility tables for context. If broad market volatility is already elevated (VIX above 25), the stock's IV inflation from earnings may be partially masked by the elevated baseline. The crush may be less dramatic because IV was already high.
Risk Management: The Rules That Keep This Trade Alive
Pre-earnings trades are binary events. The stock reports, and then IV crushes. There is no time to adjust. If the stock gaps 15% and blows through your short strike, you're at max loss before the market opens. This reality demands specific risk management.
Rule 1: Size aggressively smaller than regular trades. If your standard credit spread is 3% of account risk, pre-earnings trades should be 1-2% maximum. The binary nature of the outcome (you either win or you're near max loss with no ability to adjust) requires smaller sizing.
Rule 2: Use defined-risk structures. Iron condors and credit spreads have known max loss. Short strangles do not. Unless you have significant experience and a large account, stick to defined risk.
Rule 3: Diversify across multiple earnings. Don't put your entire earnings-season allocation on one stock. Spread across 3-5 different names in different sectors. One bad gap hurts. Five bad gaps in the same week across uncorrelated sectors is extremely unlikely.
Rule 4: Use the weekly expiration closest to earnings. This maximizes the IV crush effect and minimizes the time your capital is at risk. Monthly expirations work but dilute the IV crush because they contain time value beyond the earnings event.
Rule 5: Close the morning after earnings. Don't hold for full expiration. The IV crush delivers most of your profit in the first session after the announcement. Close the trade, lock in the profit, and move on. Holding through the rest of the week exposes you to additional risk with minimal additional reward.
Rule 6: Have a maximum earnings allocation. No more than 5-8% of your total account in pre-earnings trades at any one time. Even with diversification, a broad market event (like a recession scare) during earnings season can cause correlated gaps across multiple stocks.
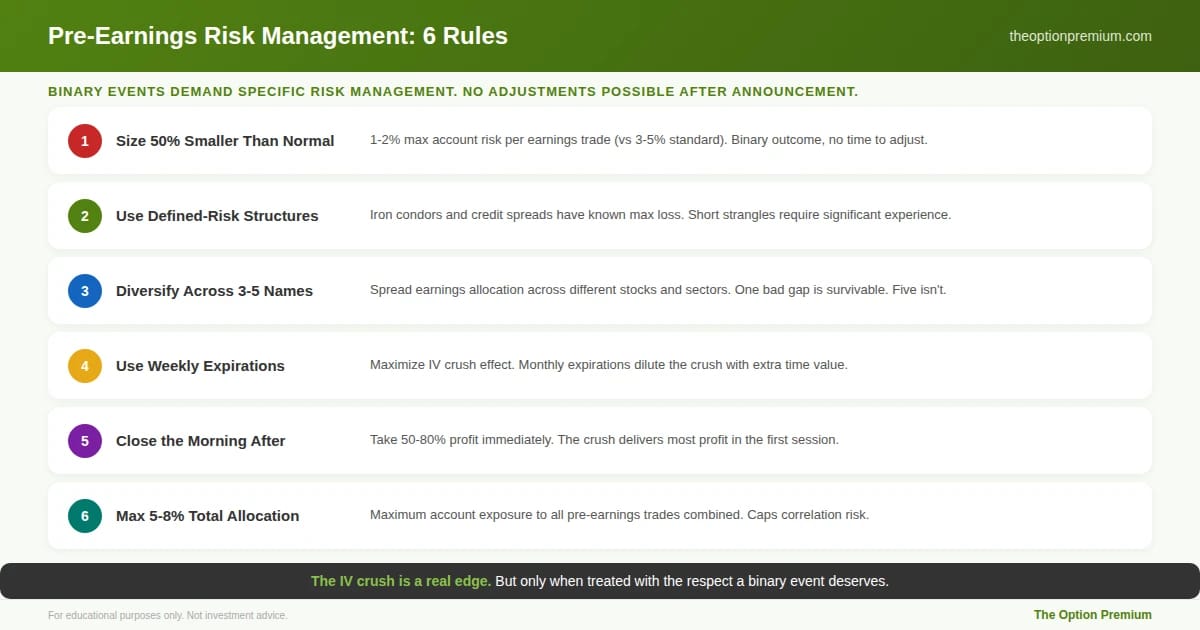
Pre-earnings trades are binary events with no ability to adjust after the announcement. These six rules keep the strategy alive through the inevitable losses. Size at half your normal allocation (1-2% vs 3-5%) because there's no time to manage. Use defined-risk structures for known max loss. Diversify across 3-5 different stocks in different sectors. Use the weekly expiration closest to earnings for maximum crush effect. Close the morning after for 50-80% of max profit. And cap your total earnings allocation at 5-8% of account.
When to Skip: Not Every Earnings Trade Is Worth Taking
Skip when IVP is below 50%. If IV isn't meaningfully elevated, the crush won't be meaningful either. You're taking binary risk without the premium to justify it.
Skip on stocks with a history of extreme moves. Some stocks (TSLA, NFLX, certain biotech names) regularly gap 10-15% on earnings. The expected move may be priced accurately or even understated. The edge of selling overpriced IV disappears when IV is correctly priced or underpriced.
Skip when the expected move is very small. If a $100 stock has an expected move of $2 (2%), the premium available outside the expected move is tiny. The ROC may not meet minimum thresholds even with the IV crush.
Skip during broad market stress. If VIX is above 30 and the market is in a correction, individual stock earnings can produce outsized moves because investors are already nervous. The baseline volatility makes the pre-earnings trade riskier without proportionally more premium.
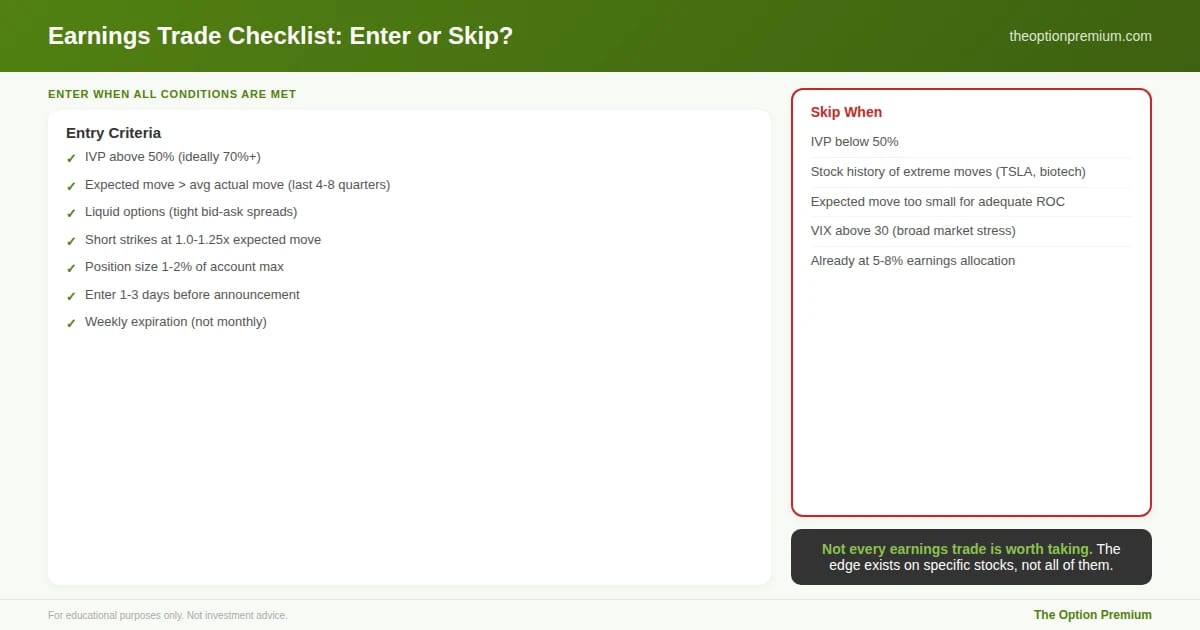
Not every earnings trade is worth taking. The entry criteria must all be met: IVP above 50% (ideally 70%+), expected move larger than the stock's average actual move over the last 4-8 quarters, liquid options with tight bid-ask spreads, short strikes at 1.0-1.25x expected move, position size at 1-2% max, entered 1-3 days before, using the weekly expiration. Skip when IVP is below 50%, the stock has a history of extreme moves that match or exceed the expected move, expected move premium is too small, VIX is above 30, or you're already at your 5-8% earnings cap
The Practitioner Edge: My Earnings Season Framework
Scan for candidates 1-2 weeks before. I look for stocks with earnings dates in the next 5-10 days, IVP above 65%, and liquid options markets (tight bid-ask spreads). The Implied Perspective watchlist helps identify these.
Calculate expected move for each candidate. ATM straddle price divided by stock price gives the expected move percentage. I compare this to the stock's historical earnings moves over the past 4-8 quarters. If the expected move is significantly larger than the average actual move, the trade has edge.
Enter 1-3 days before. Iron condor with short strikes at 1.0-1.25x the expected move. Weekly expiration. Size at 1-2% of account.
Close the morning after. Typically for 50-80% of max profit. The IV crush does the heavy lifting. Don't hold for the last 20-50% of premium.
Track results quarterly. Win rate, average profit, average loss, and the ratio between expected move and actual move for each stock. Over time, this data tells me which names consistently overprice earnings and which don't.
Risk Reality Check
Pre-earnings trades feel easy during winning streaks. You sell inflated premium, it crushes, you collect. The danger is that a 70% win rate means 3 out of every 10 trades lose, and those losses can be at or near max loss because there's no time to adjust. A single 15% gap through your iron condor strikes means full max loss on that trade.
The math only works if your sizing is conservative enough to absorb those max-loss trades without significant account damage. At 1-2% risk per earnings trade and a 70% win rate, the expected value is solidly positive. At 5% risk per trade, a 3-loss streak during one earnings season (entirely possible) costs 15% of your account. Size small. Diversify. Take profits quickly. The IV crush is a real and repeatable edge, but only when treated with the respect a binary event deserves.
Key Takeaways
Implied volatility systematically overestimates earnings moves by 15-20% on average, creating a volatility risk premium that premium sellers exploit. The IV crush, a 30-60% overnight drop in IV the moment earnings are released, is one of the most predictable patterns in options trading.
Place short strikes at 1.0-1.25x the expected move (calculated from the ATM straddle price). Stocks stay inside the expected move roughly 70-75% of the time. The iron condor is the ideal structure for most traders: defined risk, dual-sided premium, and clear max loss for sizing.
Enter 1-3 days before the announcement to capture peak IV. Confirm with IVP above 50% (ideally 70%+). Use the weekly expiration closest to earnings for maximum crush effect. Close the morning after for 50-80% of max profit.
Size at 1-2% of account (half your normal allocation) because pre-earnings trades are binary events with no ability to adjust after the announcement. Diversify across 3-5 stocks in different sectors. Maximum 5-8% total account in earnings trades at any time.
Skip when IVP is below 50%, when the stock has a history of extreme moves that match or exceed the expected move, when expected move premium is too small for adequate ROC, or during broad market stress (VIX above 30). Not every earnings trade is worth taking.
The IV crush doesn't care whether the stock goes up or down. It cares that uncertainty resolved. Sell the uncertainty before it resolves, and let the crush do the work.
Andy Crowder
📩 Want to see how a 24+ year professional options trader approaches the market?
Subscribe to The Option Premium, my free weekly newsletter where I share:
Probability-based strategies that actually work: credit spreads, cash-secured puts, the wheel, LEAPS, poor man's covered calls, and more
Real trade breakdowns with the math behind every decision
Market insights for any environment, whether we're grinding higher, pulling back, or chopping sideways
No hype. No predictions. Just the frameworks I've used to trade options for over two decades.
📺 Want more? Follow me on YouTube for in-depth tutorials, live trade analysis, and the kind of education you won't find anywhere else.
Connect with me:
This newsletter is for educational purposes only and should not be considered investment advice. Options trading involves significant risk and is not suitable for all investors. Past performance does not guarantee future results. Always consult with a qualified financial professional before making investment decisions.
Reply