- The Option Premium
- Posts
- IV Rank vs. IV Percentile: Why Every Premium Seller Needs Both (and Which One I Trust More)
IV Rank vs. IV Percentile: Why Every Premium Seller Needs Both (and Which One I Trust More)
IV Rank uses 2 data points. IV Percentile uses 252. A single spike can blind IVR for months while IVP stays accurate. Learn the formulas, the spike distortion problem, and how to use both together with real examples.

Andrew Crowder
April 18, 2026
IV Rank vs. IV Percentile: Why Every Premium Seller Needs Both (and Which One I Trust More)
If you sell options for a living, implied volatility is the signal that drives every decision you make. It tells you what strategy to use, where to place your strikes, how much premium you can collect, and whether a trade is even worth entering. But raw IV by itself is almost useless.
A stock trading at 35% implied volatility might be at the highest IV it's seen all year, making it a rich environment for selling premium. Or that same 35% might be at the lowest end of its historical range, meaning options are actually cheap and selling premium here would be collecting thin credits for outsized risk. The number alone doesn't tell you which situation you're in.
This is why IV Rank and IV Percentile exist. They provide the context that raw IV cannot. And while most traders treat them as interchangeable, they are not. They answer different questions, they have different blind spots, and one of them is meaningfully more reliable than the other for premium sellers. This article covers exactly how both work, where IV Rank breaks down, and why IV Percentile has become the metric I trust most after 24 years of trading options professionally.
What IV Rank Tells You (and What It Misses)
IV Rank measures where current implied volatility sits relative to its 52-week high and low. The formula is straightforward.
IV Rank = (Current IV - 52-Week Low IV) / (52-Week High IV - 52-Week Low IV) x 100
If a stock's IV has ranged between 20% and 40% over the past year and current IV is 34%, then IVR = (34 - 20) / (40 - 20) x 100 = 70. An IV Rank of 70 means current IV is 70% of the way between the annual low and the annual high. That's elevated. That's the kind of environment where premium sellers want to be active.
The interpretation is intuitive. IVR of 0 means IV is at the 52-week low. IVR of 100 means IV is at the 52-week high. Anything above 50 means IV is in the upper half of its annual range. For premium sellers, higher IVR means richer credits on credit spreads and iron condors, wider expected moves that allow strikes to be placed further from the current price, and a higher probability that IV will revert toward its mean after you sell, providing a vega tailwind that accelerates your profits.
That all sounds clean. But IV Rank has a significant blind spot that can mislead you at exactly the wrong time.
The Spike Distortion Problem
Here's where IV Rank falls apart. The formula uses only two data points: the 52-week high and the 52-week low. Everything between those two extremes is invisible.
Consider a stock that spent most of the past year with IV between 22% and 28%. Quiet, predictable, range-bound volatility. Then in month three, a surprise earnings miss caused IV to spike to 65% for a single week before collapsing back to normal. The rest of the year, IV returned to its usual 22-28% range.
Now suppose current IV is 30%. That's meaningfully above the stock's typical range and should represent a decent opportunity for premium sellers. But IV Rank tells a different story.
IVR = (30 - 22) / (65 - 22) x 100 = 18.6
An IVR of 18.6 suggests IV is low. Not elevated. Not worth selling. But the reality is that current IV at 30% is higher than it's been for roughly 90% of the past year. The single spike to 65% has distorted the entire calculation by stretching the denominator. One extreme event, one week out of 52, has made the formula effectively blind to what's actually happening with the stock's volatility right now.
This isn't a theoretical edge case. It happens constantly. Earnings surprises, geopolitical shocks, sector rotations, FDA announcements, any single-event volatility spike that has long since dissipated will continue to suppress IV Rank readings for up to 12 months after the spike occurred. And during that entire 12-month window, IV Rank is understating how elevated current volatility actually is relative to the stock's normal behavior.
For a premium seller relying exclusively on IV Rank, this means missed opportunities. You'd skip trades that actually have rich premium because IVR says the environment is "low." The signal is wrong, but you'd never know it by looking at a single number.
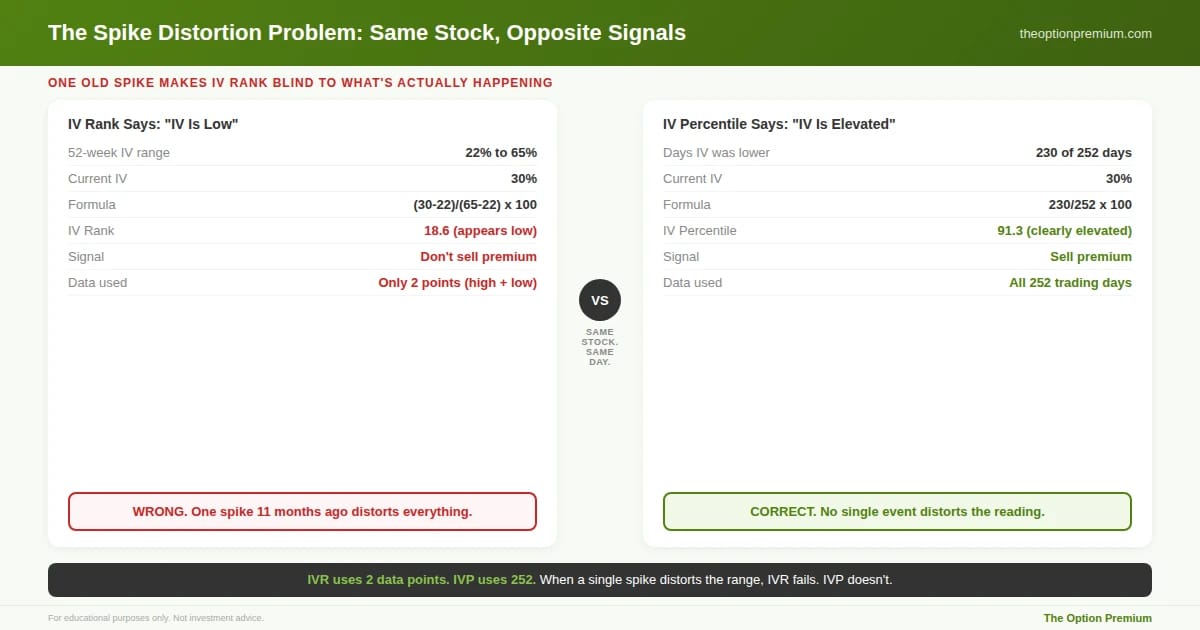
The spike distortion problem in action. A stock spent 90% of the year with IV between 22% and 28%. One week it spiked to 65%, then immediately reverted. Current IV is 30%, clearly above the stock's normal range. IV Rank: (30-22)/(65-22) x 100 = 18.6. The signal says don't sell. IV Percentile: 230 of 252 days had lower IV. IVP = 91.3. The signal says IV is quite elevated, sell premium. IVP is correct. The old spike has made IVR effectively blind to a genuinely rich premium environment.
What IV Percentile Tells You (and Why It's More Robust)
IV Percentile asks a fundamentally different question. Instead of asking "where is IV relative to the high and low?" it asks: "over the past 252 trading days, how often has IV been lower than it is today?"
IV Percentile = (Number of Days IV Was Lower Than Today) / 252 x 100
If IV was lower than today's reading on 182 out of the past 252 trading days, then IVP = 182 / 252 x 100 = 72.2. An IV Percentile of 72 means current IV is higher than it was on 72% of the trading days over the past year. That's elevated. That's a signal to sell.
The critical difference is in the data each metric uses. IV Rank uses two data points (the high and the low). IV Percentile uses all 252. Every single trading day of the past year contributes to the calculation. There is no single extreme event that can distort the result because every day gets equal weight.
Go back to the spike example. The stock spent 90% of the year between 22% and 28% IV. One week it spiked to 65%. Current IV is 30%.
IV Percentile looks at all 252 days. On roughly 230 of those days, IV was below 30%. IVP = 230 / 252 x 100 = 91.3.
An IVP of 91 tells you that current IV is higher than it was on 91% of the past year's trading days. That's very elevated. That's a strong signal to sell premium. And it's the correct reading. The spike distortion that crippled IV Rank doesn't affect IV Percentile at all because the spike was only 5 days out of 252. It gets its proportional weight (2% of the data) rather than anchoring the entire calculation.
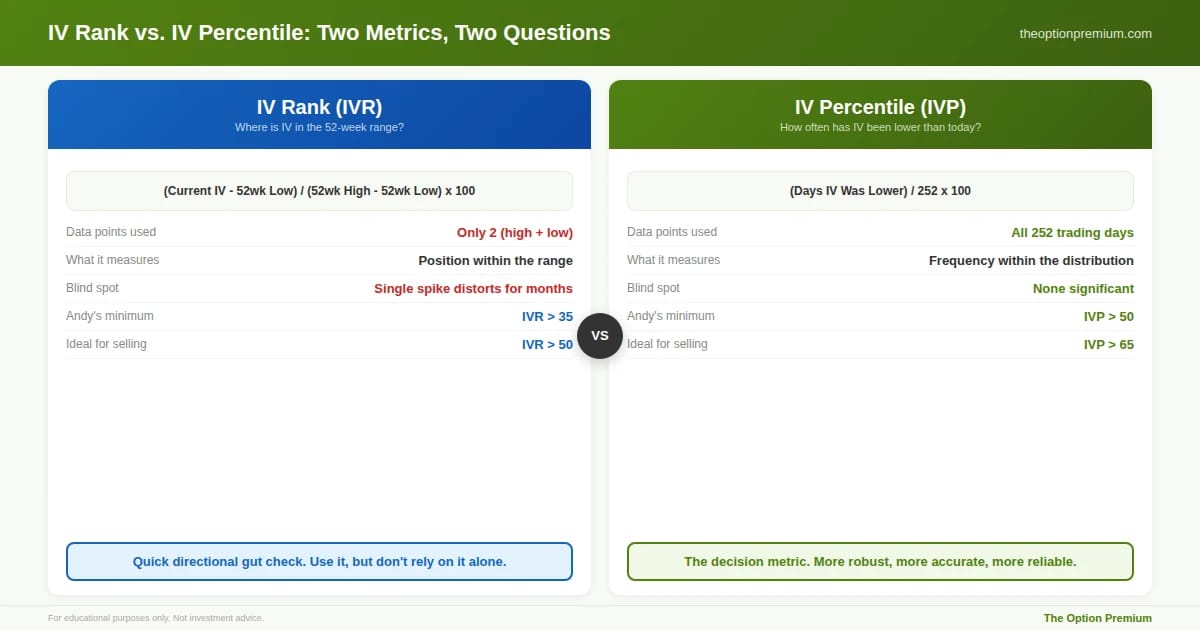
Two metrics, two questions, two very different reliability profiles. IV Rank uses only the 52-week high and low (2 data points) to determine where current IV sits in the range. IV Percentile uses every single trading day over the past year (252 data points) to determine how often IV has been lower than today. IVR is vulnerable to spike distortion: one extreme event stretches the denominator and suppresses readings for months. IVP has no equivalent blind spot because no single day dominates the calculation. Andy's minimums: IVR above 35 and IVP above 50 before considering any spread. Ideal: IVR above 50 and IVP above 65 simultaneously.
Why This Distinction Matters for Your Actual Trades
The spike distortion problem isn't academic. It shows up in real trading decisions with real dollar consequences.
Missed entries. When IV Rank is suppressed by an old spike, you skip trades that actually have rich premium. A stock with IVP of 75 (clearly elevated, worth selling) might show an IVR of 25 (appears low, seems like a pass). If you're filtering by IVR alone, you never see the opportunity.
False confidence on exits. After you've entered a position and IV drops, IVR can show a rapid decline because the denominator is so stretched by the old spike. You might think IV has fallen substantially when it has barely moved in absolute terms. This can lead to premature exits or a false sense that the vega tailwind has already played out.
Sector-wide distortions. During earnings season, many stocks in the same sector experience IV spikes within a few weeks of each other. Three months later, every stock in that sector will have a suppressed IV Rank even if current IV is meaningfully above average. If you're scanning for candidates by IVR across an entire watchlist, you could systematically miss the best opportunities in an entire sector.
IV Percentile avoids all three problems because it treats the historical data as a distribution rather than a range. No single data point dominates. The result is a more accurate, more stable, and more reliable signal for premium sellers.
How I Use Both Together
Despite the spike distortion issue, I don't ignore IV Rank entirely. I use both metrics together, but I weight them differently.
My minimums: IVR above 35 and IVP above 50 before I consider any credit spread or iron condor. But if I had to choose only one, I'd choose IV Percentile every time. It's the more robust indicator.
The strongest signal is dual confirmation. When IVR is above 50 and IVP is above 65 at the same time, both metrics are telling you the same thing: current IV is elevated by any reasonable measure. The premium is rich. The expected move is wide. The conditions favor sellers. This is where I'm most aggressive with entries (within my position sizing rules, naturally).
When they disagree, trust IVP. If IVP is above 70 but IVR is below 30, there's almost certainly a spike distortion at work. I investigate by looking at the IV chart for the past year. If I can see a single sharp spike that has long since dissipated while current IV is clearly above the stock's normal range, I trust the IVP reading and treat the environment as elevated. The IVR is a casualty of a stale extreme, not a reflection of current conditions.
When both are low, stay away. If IVR is below 25 and IVP is below 40, the environment is genuinely low-volatility. Premiums are thin. Credits don't justify the risk. Either wait for a better entry or consider strategies that benefit from low IV (buying calls, debit spreads, LEAPS).
I provide both readings every week in the Implied Perspective watchlist alongside oversold/overbought readings and trend metrics across multiple timeframes. It's the starting point for every trade idea.
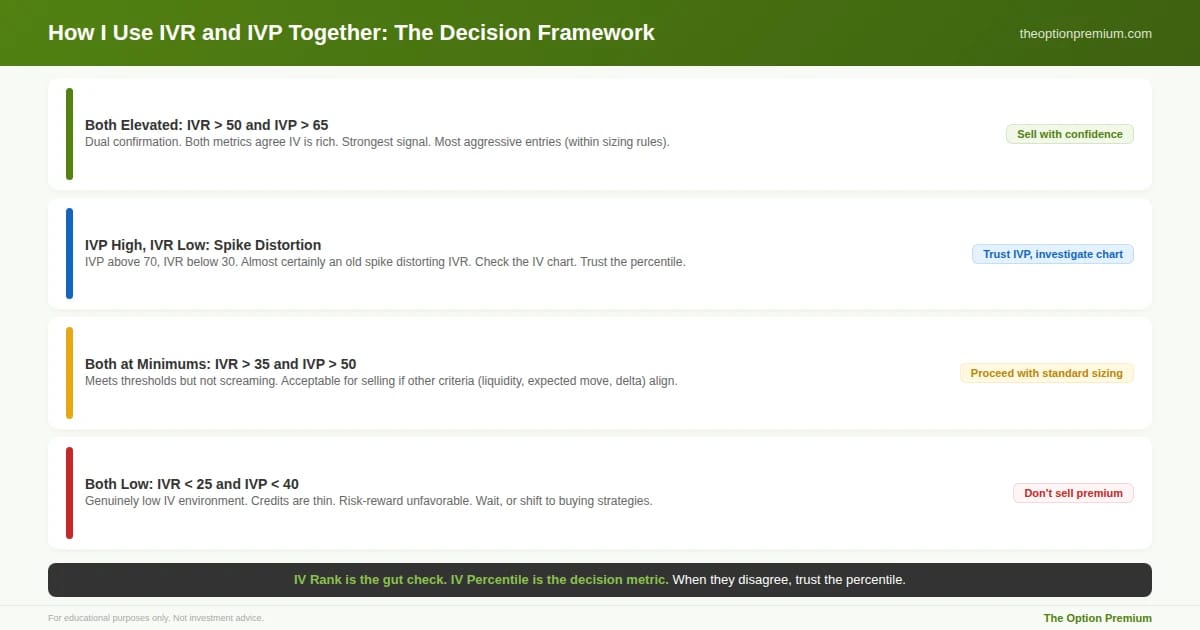
The practical decision framework for using IVR and IVP together. When both are elevated (IVR above 50, IVP above 65), you have dual confirmation and the strongest signal to sell. When IVP is high but IVR is low, there's almost certainly a spike distortion at work. Check the IV chart and trust the percentile. When both meet minimums (IVR above 35, IVP above 50), proceed with standard sizing if other criteria align. When both are low (IVR below 25, IVP below 40), the environment is genuinely cheap. Don't sell premium. IV Rank is the gut check. IV Percentile is the decision metric.
A Real-World Example: Same Stock, Opposite Signals
Let me walk through a situation I see regularly. A large-cap tech stock, call it Stock XYZ, trading at $180. Over the past year, IV has ranged from 24% to 72%, with the 72% reading occurring during a one-week panic in month two that immediately reverted. For the other 49 weeks of the year, IV has ranged between 24% and 38%.
Current IV: 36%.
IV Rank: (36 - 24) / (72 - 24) x 100 = 25. IVR says IV is in the bottom quarter of its range. The signal: IV is low, don't sell.
IV Percentile: Over 252 trading days, IV was below 36% on approximately 215 days. IVP = 215 / 252 x 100 = 85.3. IVP says current IV is higher than 85% of the past year's readings. The signal: IV is quite elevated, premium is rich.
The correct answer? IVP is right. The stock's "normal" IV lives between 24% and 38%. At 36%, you're near the top of that range. The one-week spike to 72% was an anomaly that doesn't reflect the stock's actual volatility regime. Selling premium at 36% IV on this stock, with strikes outside the expected move, is a trade with genuine edge. IV Rank would have you skip it entirely.
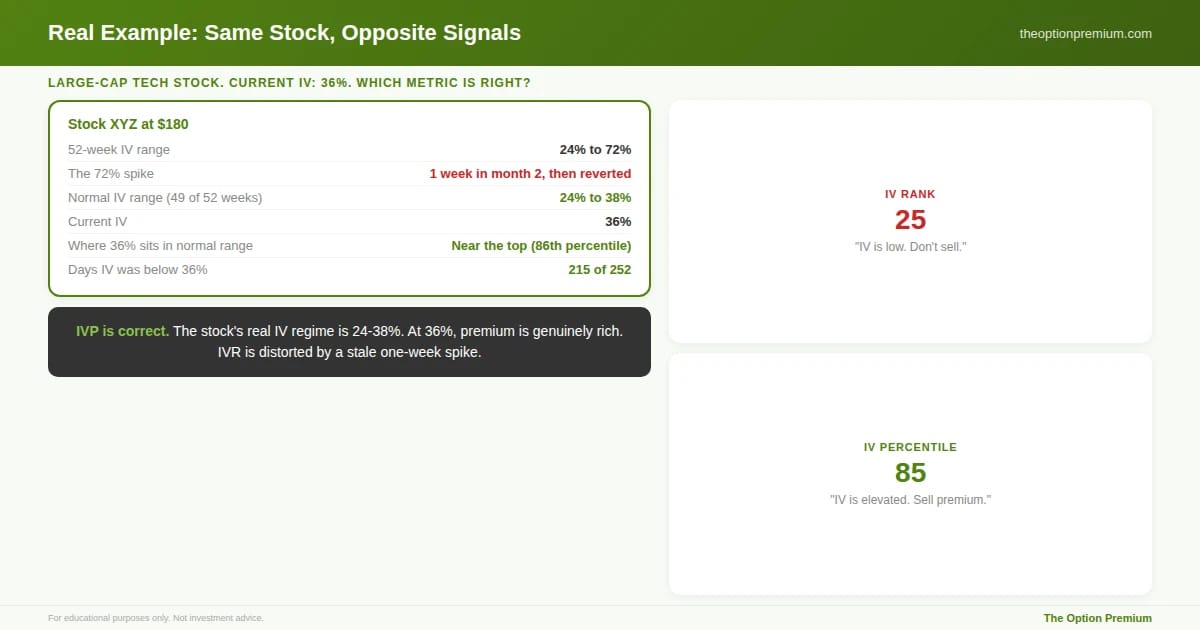
A real-world example showing the divergence. Stock XYZ at $180. The 52-week IV range stretches from 24% to 72%, but the 72% was a single-week panic in month two that immediately reverted. For 49 of 52 weeks, IV lived between 24% and 38%. Current IV at 36% is near the top of the stock's actual volatility regime. IVR says 25 (appears low). IVP says 85 (clearly elevated). IVP is right. Selling premium at 36% IV on this stock has genuine edge. IV Rank would have you skip it entirely.
The Practitioner Edge: My IV Screening Rules
Always check both, but lean on IVP. IVR is a quick directional gut check. IVP is the decision metric. When they agree, confidence is high. When they disagree, investigate the IV chart and trust the percentile.
Minimum thresholds for selling. IVR above 35. IVP above 50. Both must be met. If one is below its threshold, I need a clear reason to override it (and the reason is almost always the spike distortion pattern described above, confirmed by looking at the chart).
Ideal entry zone. IVR above 50 and IVP above 65 simultaneously. This dual confirmation means IV is elevated by both absolute range and distributional frequency. The premium is genuinely rich, the expected move is wide, and mean reversion is your tailwind.
Don't sell premium when both are low. If IVR is below 25 and IVP is below 40, the options market is priced for very little movement. The credits available on 0.15-0.20 delta spreads will be thin, and the risk-reward ratio will be unfavorable. Wait for a better environment or shift to buying strategies that benefit from a potential IV expansion.
Update your reads weekly. IV Rank and IV Percentile change every day as new data enters the 252-day lookback window. A stock that was IVP 40 last month might be IVP 65 this week after a sector-wide selloff elevated premiums. The weekly watchlist refresh is how I catch these shifts before they've already faded.
Risk Reality Check
Neither IV Rank nor IV Percentile guarantees that selling premium will be profitable. An IVP of 80 doesn't mean IV can't go higher. It can. Volatility can spike further, and your short options can move against you even when every metric said the environment was favorable for sellers. An elevated IVP increases the probability that you're selling rich premium and that IV will revert, but it doesn't make the outcome certain.
This is why IV metrics are one input in a multi-step process, not a standalone decision tool. Liquidity, expected move mapping, strike selection, position sizing, and written management rules all sit on top of the IV confirmation. The IV signal tells you the environment is favorable. The rest of the process ensures you're positioned to survive even when the favorable environment produces an unfavorable outcome on a specific trade.
Key Takeaways
IV Rank measures where current IV sits relative to its 52-week high and low using only two data points. It's intuitive and widely available, but it has a significant blind spot: a single volatility spike (even one that dissipated months ago) distorts the range and can suppress IVR readings for up to 12 months, causing you to miss genuinely elevated premium environments.
IV Percentile measures how often IV has been lower than today over the past 252 trading days, using every single day's data. Because no single extreme event dominates the calculation, IVP provides a more accurate, more stable signal for whether current IV is truly elevated. If I could only use one metric, I'd choose IV Percentile every time.
Use both together, but weight IVP more heavily. Minimum thresholds for selling: IVR above 35 and IVP above 50. The strongest signal is dual confirmation (IVR above 50 and IVP above 65 simultaneously). When they disagree, trust IVP and investigate the IV chart for spike distortion.
The practical impact is real. Spike distortion causes missed entries on stocks where premium is genuinely rich, false confidence on exits, and sector-wide blind spots during earnings season. IV Percentile avoids all three problems because it treats the data as a distribution rather than a range anchored by extremes.
IV metrics are one input, not the whole decision. Liquidity, expected move mapping, delta-based strike selection, position sizing (2-5% per trade), and written management rules all sit on top of the IV confirmation. The IV signal tells you the environment is favorable. The process ensures you survive even when a specific trade goes against you.
IV Rank will tell you the neighborhood. IV Percentile will tell you the exact address. For premium sellers, the exact address is what matters.
Andy Crowder
📩 Want to see how a 24+ year professional options trader approaches the market?
Subscribe to The Option Premium, my free weekly newsletter where I share:
Probability-based strategies that actually work: credit spreads, cash-secured puts, the wheel, LEAPS, poor man's covered calls, and more
Real trade breakdowns with the math behind every decision
Market insights for any environment, whether we're grinding higher, pulling back, or chopping sideways
No hype. No predictions. Just the frameworks I've used to trade options for over two decades.
📺 Want more? Follow me on YouTube for in-depth tutorials, live trade analysis, and the kind of education you won't find anywhere else.
Connect with me:
This newsletter is for educational purposes only and should not be considered investment advice. Options trading involves significant risk and is not suitable for all investors. Past performance does not guarantee future results. Always consult with a qualified financial professional before making investment decisions.
Reply