- The Option Premium
- Posts
- The Implied Truth: How to Read Our Weekly Volatility Tables
The Implied Truth: How to Read Our Weekly Volatility Tables
Learn to read The Option Premium's weekly volatility tables in under 2 minutes. Covers IV Rank, IV Percentile, relative strength, ADX, and a 5-step scan to find the richest premium-selling setups.

Andrew Crowder
March 15, 2026
The Implied Truth: How to Read Our Weekly Volatility Tables
Every week, I publish a volatility dashboard covering 30+ ETFs and market indicators. It's the same table I use to decide where to sell premium, what to avoid, and how to position my portfolio. But a table full of numbers is only useful if you know what each column tells you and how to combine them into actionable decisions.
This guide is your decoder ring. By the time you finish, you'll know exactly what every column means, which numbers matter most for premium sellers, and how to scan the table in under two minutes to find the best opportunities each week.
The Table at a Glance: What You're Looking At
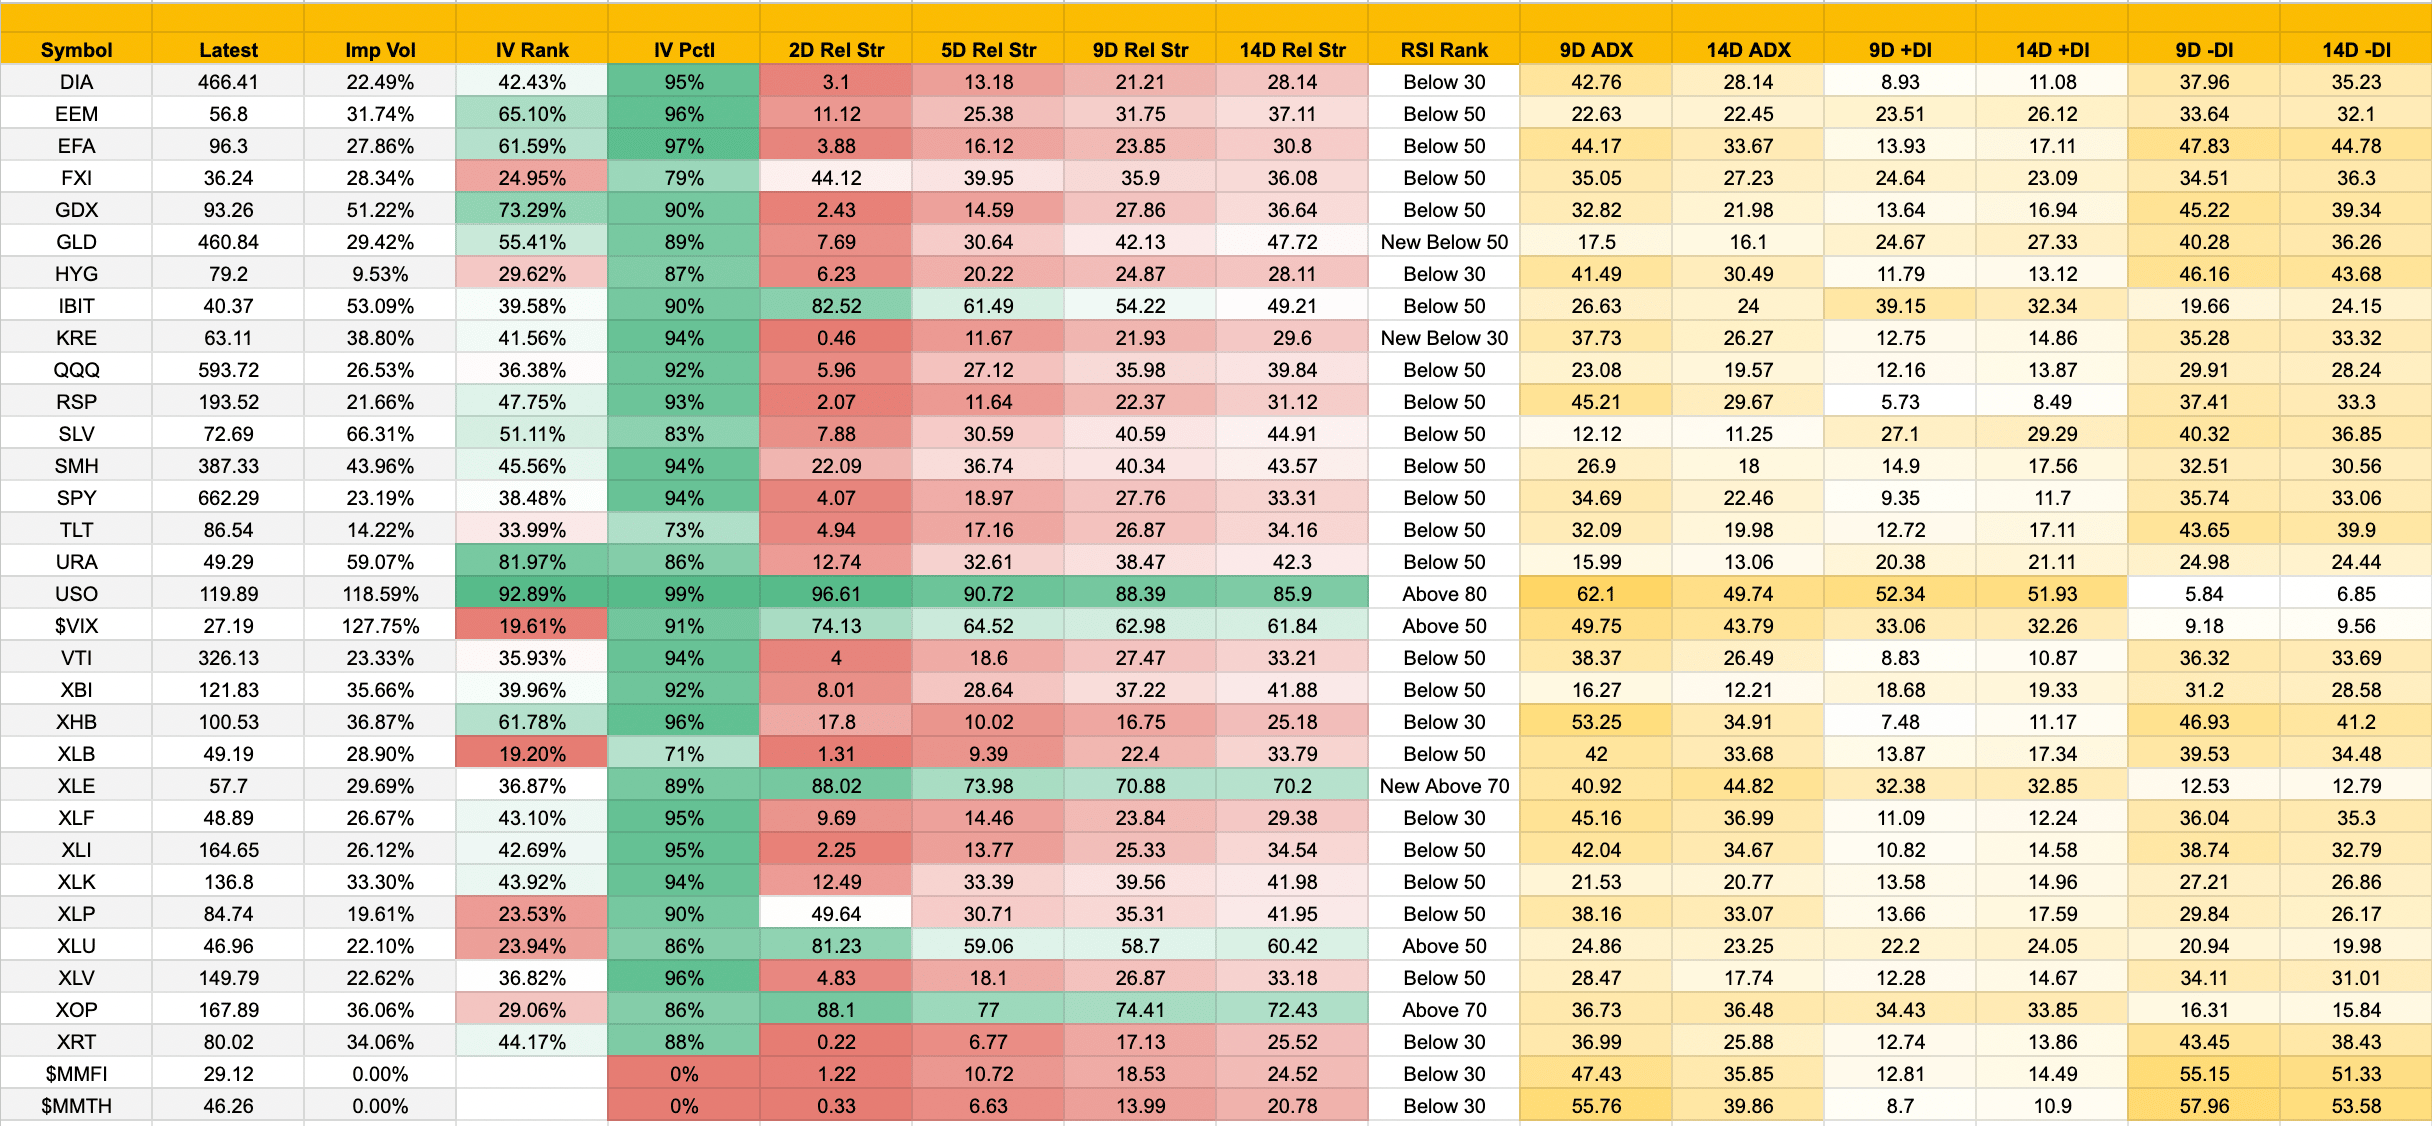
The weekly volatility table tracks ETFs across sectors, asset classes, and market themes. You'll find broad indexes (SPY, QQQ, DIA), sectors (XLF, XLK, XLE, XLV), commodities (GLD, SLV, USO), fixed income (TLT, HYG), international (EEM, EFA, FXI), and specialty plays (IBIT, URA, XBI). At the bottom, two market breadth indicators ($MMFI and $MMTH) and the VIX give you the big-picture context.
Each row is a snapshot of where that ETF sits right now across three dimensions: volatility (is premium rich or cheap?), trend (which direction is it moving and how strongly?), and momentum (is the move accelerating or fading?). Premium sellers need all three to make informed decisions.
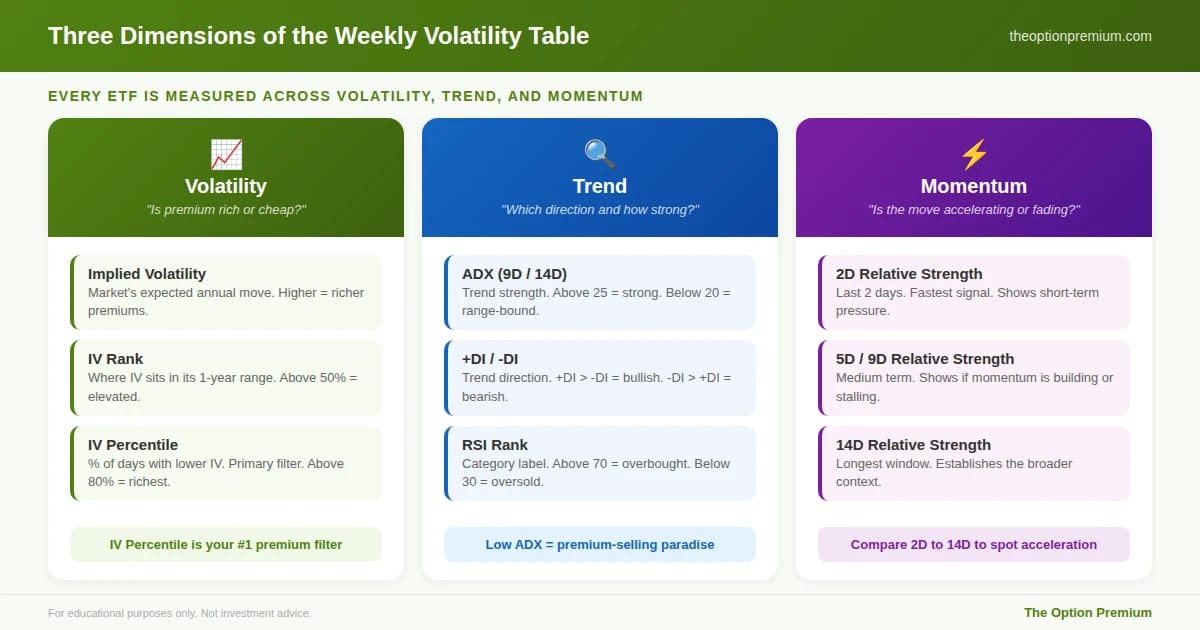
Every ETF in the weekly table is measured across three dimensions. Volatility tells you if premiums are rich (IV Percentile is your #1 filter). Trend tells you direction and strength (low ADX means range-bound, the best environment for premium sellers). Momentum shows whether the move is accelerating or fading (compare 2D to 14D relative strength to spot the shift).
Column by Column: The Volatility Block
The first group of columns tells you whether options premiums are worth selling right now.
Imp Vol (Implied Volatility). This is the market's current expectation for how much the ETF will move over the next year, expressed as a percentage. SPY at 23.19% means the market expects SPY to move roughly 23.19% annualized, or about 1.5% per week (divide by the square root of 52). Higher IV means richer premiums. Lower IV means thinner premiums. But raw IV alone doesn't tell you whether it's high or low for that specific ETF. That's what the next two columns do.
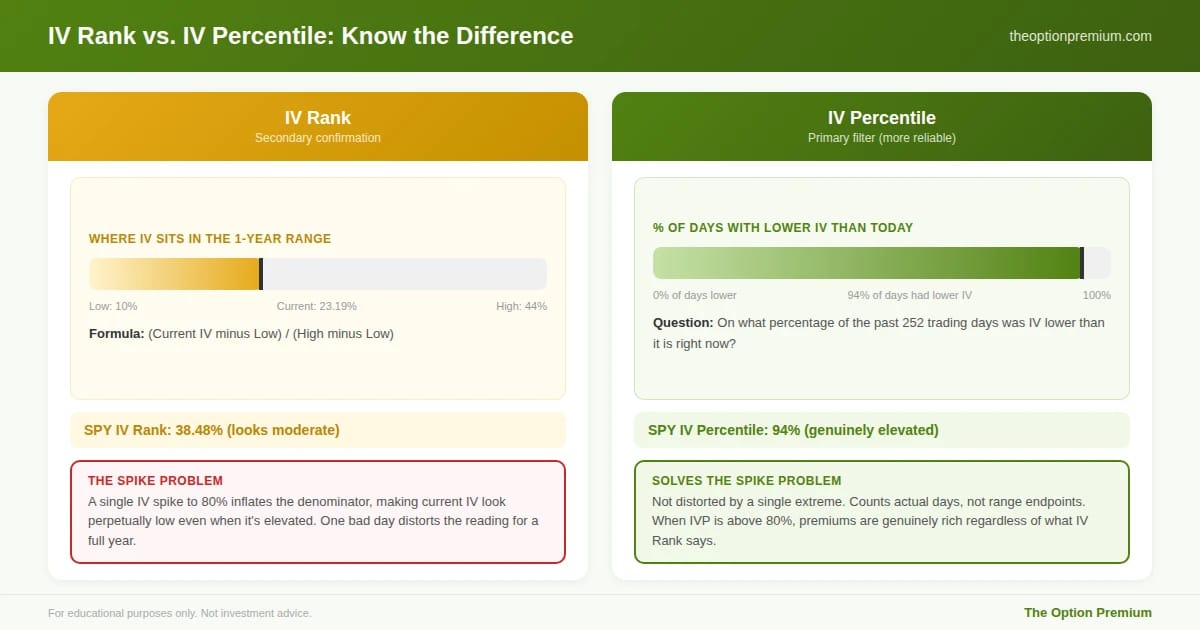
IV Rank. Where current IV sits relative to the past year's range, expressed as a percentage. If SPY's IV ranged from 10% to 40% over the past year, and current IV is 23.19%, the IV Rank is (23.19 minus 10) / (40 minus 10) = 43.9%. An IV Rank of 50% means IV is exactly in the middle of its annual range. Above 50% means IV is on the higher side. Below 25% means options are relatively cheap.
The problem with IV Rank. A single extreme spike (like a crash) can distort the range for an entire year. If IV spiked to 80% once, the denominator gets inflated, making current IV look perpetually low even when it's actually elevated. This is the "spike problem."
IV Percentile. This solves the spike problem. Instead of asking where IV sits in the range, it asks: what percentage of trading days over the past year had IV lower than today? An IV Percentile of 94% means IV was lower than today's level on 94% of all trading days in the past year. This is more reliable for premium sellers because it isn't distorted by a single spike.
How I use both together. IV Percentile is my primary filter. I want to see IV Percentile above 50% (ideally above 70%) before I sell premium. IV Rank is my secondary confirmation. When both are elevated, premiums are genuinely rich. When IV Rank is low but IV Percentile is high, the spike problem is likely at play, and IV Percentile is giving you the more accurate reading. Look at this week's SPY: IV Rank reads 38.48% (looks moderate), but IV Percentile reads 94% (genuinely elevated). The spike problem is distorting IV Rank. Trust the Percentile.
Quick scan rule: Look for ETFs where IV Percentile is above 80%. Those are the richest premium environments on the board this week.
This week's SPY illustrates the gap perfectly. IV Rank reads 38.48% (looks moderate) because a prior volatility spike inflated the annual range. IV Percentile reads 94%, meaning IV is higher right now than on 94% of trading days over the past year. When these two disagree, trust IV Percentile. It counts actual days, not distorted range endpoints.
Column by Column: The Relative Strength Block
The next four columns measure directional momentum over different timeframes.
2D, 5D, 9D, 14D Relative Strength. These show where the ETF's price sits relative to its range over the past 2, 5, 9, and 14 days, scaled from 0 to 100. A reading of 50 means the ETF is in the middle of its recent range. Below 30 means it's near the bottom of its range (recently weak). Above 70 means it's near the top (recently strong).
Why multiple timeframes matter. They show you acceleration and deceleration. If the 2-day relative strength is 2 and the 14-day is 31, the ETF has been declining recently and the selling pressure is intensifying in the short term. If the 2-day is 12 and the 14-day is 37, selling pressure may be fading slightly, suggesting the pace of the decline is slowing.
How I use relative strength for premium selling. I'm looking for two patterns:
For bull put spreads (credit spreads below the market): I want to see relative strength that has been low and is starting to stabilize or turn up. A stock that's been beaten down (low 14D reading) with a 2D reading that's ticking higher suggests the selling may be exhausting. Combining this with elevated IV Percentile (which typically spikes during selloffs) creates an ideal entry for selling puts. This week, look at XLP: 14D relative strength at 41.95, but 2D has jumped to 49.64. The short-term selling has stalled and buyers are stepping in, while IV Percentile sits at 90%.
For bear call spreads (credit spreads above the market): I want sustained high relative strength with IV Percentile above 50%. Strong uptrends with rich premiums are less common but do appear, particularly in commodity ETFs. This week, XLE shows 2D relative strength of 88.02, 14D at 70.20, with RSI Rank "New Above 70" and IV Percentile at 89%. Energy is in a sustained uptrend with rich premiums.
RSI Rank. This column simplifies the relative strength into a category: Above 80 (overbought), Above 70, Above 50 (neutral-bullish), Below 50 (neutral-bearish), Below 30 (oversold), New Below 30 (just entered oversold). For premium sellers, the extremes matter most. "Below 30" or "New Below 30" on a quality ETF with high IV Percentile is a textbook bull put spread setup. This week, five names just entered "New Below 30" or sit at "Below 30": KRE, XLF, XRT, XHB, and DIA, all with IV Percentile above 90%. That's a cluster of oversold, high-premium opportunities.
Column by Column: The Trend Strength Block (ADX and Directional Indicators)
The final group tells you how strong the current trend is and which direction it favors.
9D ADX and 14D ADX (Average Directional Index). ADX measures the strength of a trend, not its direction. Readings above 25 indicate a strong trend. Readings below 20 indicate a weak or sideways market. The 9-day version reacts faster; the 14-day version is smoother.
Why ADX matters for premium sellers. Strong trends (ADX above 30) mean the ETF is moving directionally with conviction. This is important context: selling premium against a strong trend is riskier because the trend is more likely to continue. Weak ADX (below 20) suggests range-bound conditions, which is exactly what iron condor sellers want.
+DI and -DI (Directional Indicators). These tell you which direction the trend favors. When +DI is above -DI, the trend is bullish. When -DI is above +DI, the trend is bearish. The wider the gap, the stronger the directional bias.
Reading the combination. Here's the practical framework:
ADX above 25 with -DI above +DI = strong downtrend. Be cautious selling put spreads here unless IV is extremely elevated and you size conservatively. The trend may continue. This week, XHB is the clearest example: 9D ADX at 53.25 with -DI at 46.93 and +DI at just 7.48. That's a powerful downtrend with strong conviction. Selling puts here means fighting the trend.
ADX above 25 with +DI above -DI = strong uptrend. Selling covered calls against long positions works well here. Be cautious with bear call spreads unless you have high conviction the trend is exhausting. XLE shows this pattern: 9D ADX at 40.92, +DI at 32.38, -DI at 12.53. Strong bullish trend.
ADX below 20 with +DI and -DI close together = directionless, range-bound. This is premium-selling paradise. Iron condors, strangles on broad ETFs, and credit spreads on both sides all thrive in this environment. This week, SLV fits the profile: 9D ADX at 12.12, +DI at 27.10, -DI at 40.32. Weak trend despite the slight bearish lean. URA is similar with ADX at 15.99.
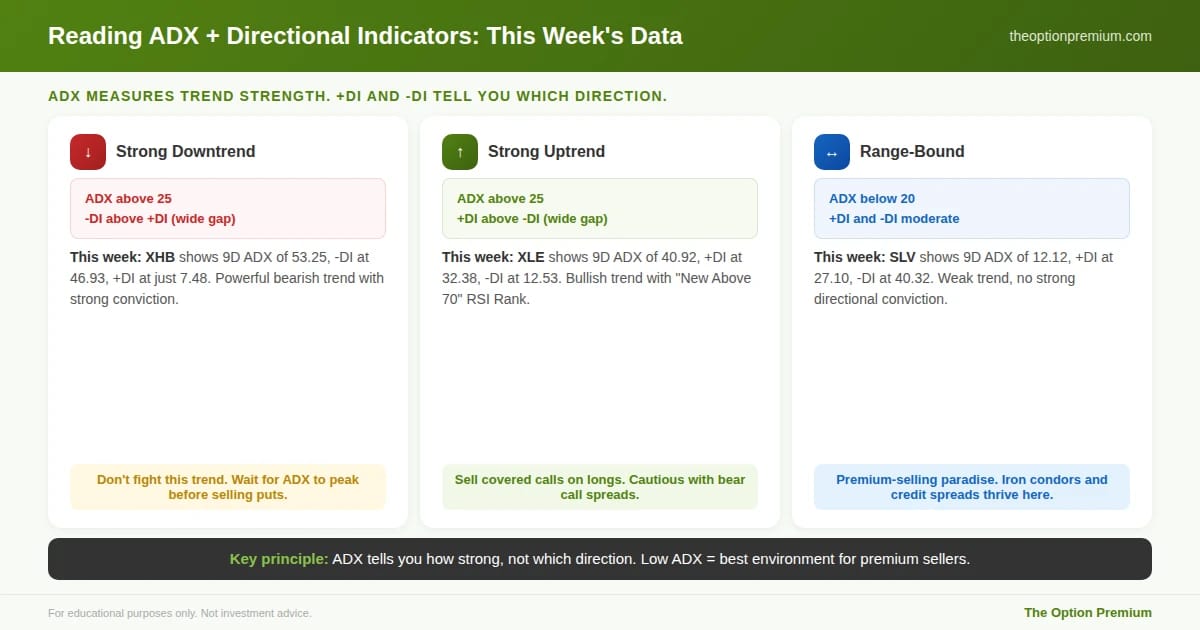
Three real scenarios from this week's table. XHB: powerful downtrend (ADX 53.25, -DI at 46.93, +DI at just 7.48). Don't sell puts into this. XLE: strong bullish trend (ADX 40.92, +DI at 32.38), ideal for covered calls. SLV: range-bound (ADX 12.12), weak trend with no conviction. Premium-selling paradise. The key principle: ADX tells you how strong the trend is, not which direction. Low ADX is your friend.
The Big-Picture Indicators: VIX and Market Breadth
Three rows at the bottom of the table aren't tradeable ETFs. They're context indicators.
$VIX. The market's "fear gauge." VIX above 20 generally means elevated anxiety and richer premiums across the board. VIX above 30 means significant fear. VIX below 15 means complacency and thinner premiums. This week, VIX sits at 27.19 with an IV Percentile of 91%. Fear is elevated and premiums are rich across the board. The 2D relative strength of 74.13 tells us fear has spiked recently but is off its most extreme levels.
$MMFI (Intermediate-Term Market Breadth). This measures the percentage of stocks above their 50-day moving average. At 29.12, fewer than 30% of stocks are above their 50-day MA. That's a significant deterioration from recent weeks and signals broad intermediate-term weakness. Below 30% is a warning flag: the average stock is struggling, and you should be highly selective about where you sell premium.
$MMTH (Long-Term Market Breadth). Same concept but against the 200-day moving average. At 46.26, fewer than half of all stocks are above their long-term average. This is now below 50% for the first time in this cycle, which is a meaningful warning sign. When both breadth indicators are declining with RSI Rank at "Below 30," the broad market is under real stress.
How I use breadth with the table. When breadth is this weak ($MMFI below 30%), I lean toward bull put spreads only on the strongest-looking ETFs (those with the highest relative strength readings or signs of stabilization) because they're holding up while the broad market is weak. I reduce overall position count and keep tighter position sizing. When breadth is strong (above 60%), I'm more comfortable selling premium across a wider range of underlyings.
Putting It All Together: A 2-Minute Scan
Here's my exact process when I open the weekly table:
Step 1: Check VIX and breadth (10 seconds). VIX at 27.19 with an IV Percentile of 91% tells me fear is elevated and premiums across the board are rich. Breadth is deteriorating: $MMFI at 29.12 and $MMTH at 46.26, both with "Below 30" RSI Rank. Context: very high-premium environment but the broad market is under stress. Be selective, not aggressive.
Step 2: Sort by IV Percentile (20 seconds). Scan for ETFs with IV Percentile above 90%. This week: EFA (97%), XHB (96%), XLV (96%), DIA (95%), XLF (95%), XLI (95%), KRE (94%), SPY (94%), VTI (94%), SMH (94%), XLK (94%). That's 11 names with IV Percentile at 94% or above. Premium is universally rich this week.
Step 3: Check relative strength on the high-IV names (30 seconds). Among those high-IV-Percentile names, which have low relative strength (potential bull put spread setups)? KRE at 0.46 2D relative strength (New Below 30 RSI), XRT at 0.22, RSP at 2.07, XLI at 2.25, DIA at 3.10. These are the most beaten-down names. For stabilization signals, look at where 2D compares to 14D: XLK shows 12.49 2D vs 41.98 14D, meaning the short-term selling is less severe than the broader trend. SMH is similar at 22.09 vs 43.57. These might be closer to a stabilization point.
Step 4: Confirm with ADX and direction (30 seconds). Among the beaten-down names, check if the downtrend is strengthening or fading. XHB: ADX at 53.25 with -DI at 46.93 and +DI at 7.48. Very strong downtrend, still accelerating. I'd avoid selling puts here despite the 96% IV Percentile. Compare to QQQ: ADX at 23.08 (moderate), -DI at 29.91, +DI at 12.16. Bearish lean but the trend isn't overpowering. More comfortable selling puts on QQQ with appropriate delta and sizing.
Step 5: Look for outliers (30 seconds). USO stands out again: IV Rank 92.89%, IV Percentile 99%, RSI Rank "Above 80," 2D relative strength 96.61. Extreme across every metric. The energy complex (XLE at "New Above 70," XOP at "Above 70") is in a strong uptrend while everything else weakens. IBIT is another outlier: 2D relative strength of 82.52 (sharp bounce) while IV Percentile is 90%. Bitcoin is diverging from the broader equity selloff.
Total time: about 2 minutes. You've identified the richest premium environments, assessed directional context, confirmed trend strength, and flagged outliers.
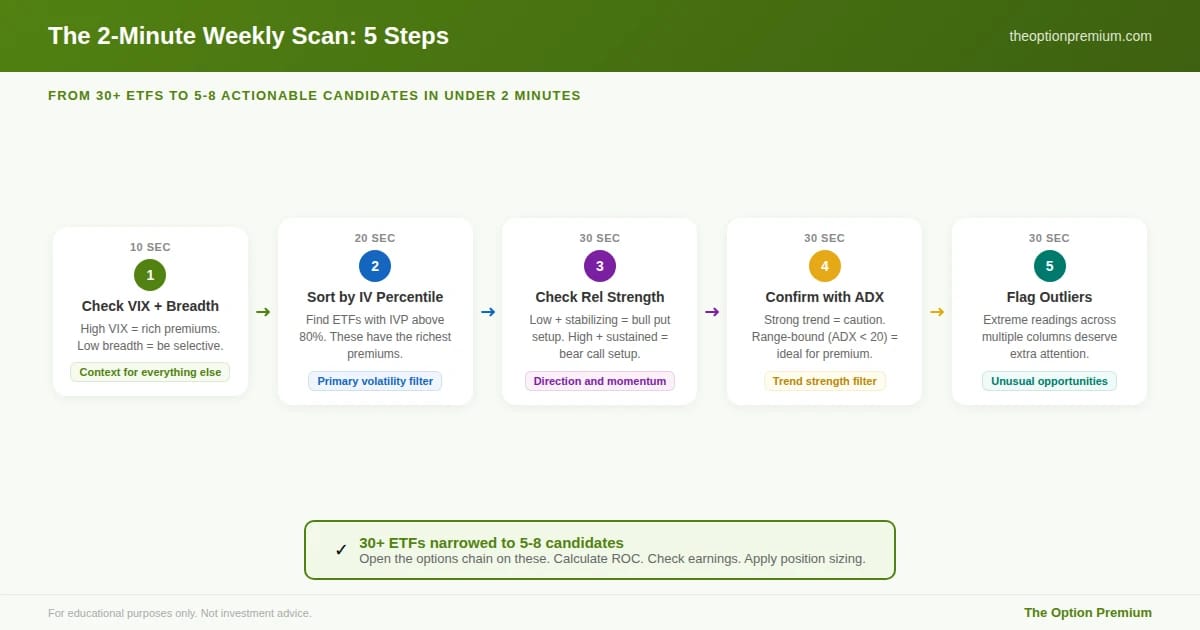
The exact 5-step process I use every week. Start with VIX and breadth for context (10 seconds). Sort by IV Percentile above 80% (20 seconds). Check relative strength for directional setups (30 seconds). Confirm trend strength with ADX (30 seconds). Flag outliers with extreme multi-column readings (30 seconds). Total: under 2 minutes. Result: 30+ ETFs narrowed to 5-8 candidates worth opening the options chain on.
What the Table Doesn't Tell You
The table is a screening tool, not a trading system. It tells you where to look, not exactly what to trade. You still need to:
Open the options chain on your candidates and check actual premiums at your target delta. Calculate return on capital to confirm the trade meets your minimum threshold. Check the earnings calendar (don't sell 30-day premium into an earnings date). Apply your position sizing rules. And confirm the trade fits your overall portfolio exposure.
The table narrows 30+ ETFs down to 5-8 actionable candidates in two minutes. The rest of your analysis happens at the options chain level.
Want to go deeper? In addition to the weekly ETF volatility table, my Implied Perspective service provides a curated watchlist of 100 individual equities with liquid options, screened using the same volatility, trend, and momentum framework. If you're looking for premium-selling opportunities beyond ETFs, with tight bid-ask spreads and sufficient open interest to enter and exit cleanly, the 100-equity watchlist is where I find the majority of my individual stock trades each week.
Key Takeaways

The weekly volatility table measures three dimensions for each ETF: volatility (is premium rich?), trend direction and strength (which way is it moving?), and momentum (is the move accelerating or fading?). Premium sellers need all three.
IV Percentile is your primary volatility filter. It tells you what percentage of the past year's trading days had lower IV than today, and it solves the "spike problem" that distorts IV Rank. This week, SPY's IV Rank reads 38.48% (moderate), but IV Percentile reads 94% (genuinely rich). Trust the Percentile. Look for IV Percentile above 80% for the richest premium environments.
Relative strength across 2, 5, 9, and 14 days shows directional momentum and whether it's accelerating or decelerating. Low readings with stabilization suggest the selloff may be exhausting, which combined with high IV creates the classic bull put spread setup. This week, XLP and SMH show early signs of stabilization.
ADX tells you trend strength (above 25 = strong, below 20 = range-bound), while +DI and -DI tell you direction. Range-bound conditions (low ADX) are premium-selling paradise. Strong trends require more caution. This week, XHB's ADX of 53.25 screams "don't fight this trend." SLV's ADX of 12.12 says "premium sellers welcome."
The 2-minute scan: check VIX and breadth for context (VIX 27.19, breadth weak at 29.12), sort by IV Percentile for the richest names (11 ETFs above 94% this week), check relative strength for direction, confirm with ADX, and flag outliers (USO extreme, energy complex diverging bullish, IBIT bouncing). This narrows 30+ ETFs to 5-8 candidates worth opening the options chain on.
The table doesn't make the decision for you. It makes sure you're looking in the right places.
Andy Crowder
📩 Want to see how a 24+ year professional options trader approaches the market?
Subscribe to The Option Premium, my free weekly newsletter where I share:
Probability-based strategies that actually work: credit spreads, cash-secured puts, the wheel, LEAPS, poor man's covered calls, and more
Real trade breakdowns with the math behind every decision
Market insights for any environment, whether we're grinding higher, pulling back, or chopping sideways
No hype. No predictions. Just the frameworks I've used to trade options for over two decades.
📺 Want more? Follow me on YouTube for in-depth tutorials, live trade analysis, and the kind of education you won't find anywhere else.
Connect with me:
This newsletter is for educational purposes only and should not be considered investment advice. Options trading involves significant risk and is not suitable for all investors. Past performance does not guarantee future results. Always consult with a qualified financial professional before making investment decisions.
Reply