- The Option Premium
- Posts
- Advanced Options Strategies: The Professional's Guide to Premium Selling, Credit Spreads, Iron Condors, and Earnings Plays
Advanced Options Strategies: The Professional's Guide to Premium Selling, Credit Spreads, Iron Condors, and Earnings Plays
24 years of professional options trading in one comprehensive guide. The complete framework: why selling premium works, IV Rank and IV Percentile, the expected move formula, the 7-step process, credit spread and iron condor management rules, a real Visa earnings trade, and the 5 mistakes that destroy traders.

Andrew Crowder
April 04, 2026

Advanced Options Strategies: The Professional's Guide to Premium Selling, Credit Spreads, Iron Condors, and Earnings Plays
There is a single idea that separates professional options traders from everyone else. It's not a secret indicator. It's not a proprietary algorithm. It's not access to better data. It's a mindset shift that, once you internalize it, changes every decision you make.
Probabilities over predictions.
I have been a professional options trader for over 24 years. Early in my career, I had the privilege of working side by side with one of the original CBOE market makers. That experience shaped everything. It's where I learned how professional market makers actually think about this business, and why premium selling sits at the absolute core of everything they do. I'm not here to predict the market. Nobody does that consistently. What I'm here to do is walk through the approach that puts the math on your side and then manage it with enough discipline to let that math actually work.
That's the whole game.
Why the Best Traders Are Sellers, Not Buyers
Most of the successful professional options traders I've known over the past 24 years are sellers, not buyers. That's not an opinion. That's just what I've seen with my own eyes and in the academic data. I'm talking peer-reviewed academic papers.
I want to be fair here. Buying options has its place. If implied volatility is really low, if you have a high-conviction directional view, if you're looking at an event where a big move is likely and the options are cheap, buying can make total sense. I use poor man's covered calls across multiple portfolios and I use low-IV environments to buy hedges, oftentimes using the VIX as my underlying of choice.
But as your primary income-generating approach? Selling options is the only consistent way.
Think about what you're fighting when you're an options buyer, particularly trading over the short term. Every single day the option loses value just by existing. Time is working against you constantly. And to actually make money, you need to be spot on about direction, spot on about timing, and right about how far the stock moves. Three things simultaneously. That's tough. Particularly when you think about having to do it over and over and over.
Now flip it. When you sell premium, time works for you every day. The stock just needs to not move too far against you. And here's the part that changes everything: with each trade, you choose your own probability of success. That's right. You choose it. Your probability of success is defined before you ever enter the trade. In my case, typically 70 to 85 percent. And because implied volatility historically prices in more movement than actually occurs, you're benefiting from that systematic overpricing every time you sell.
The long-term professional options traders I've known sell premium as their core approach. Buying is a tool they pick up occasionally for specific situations. Selling is the foundation.
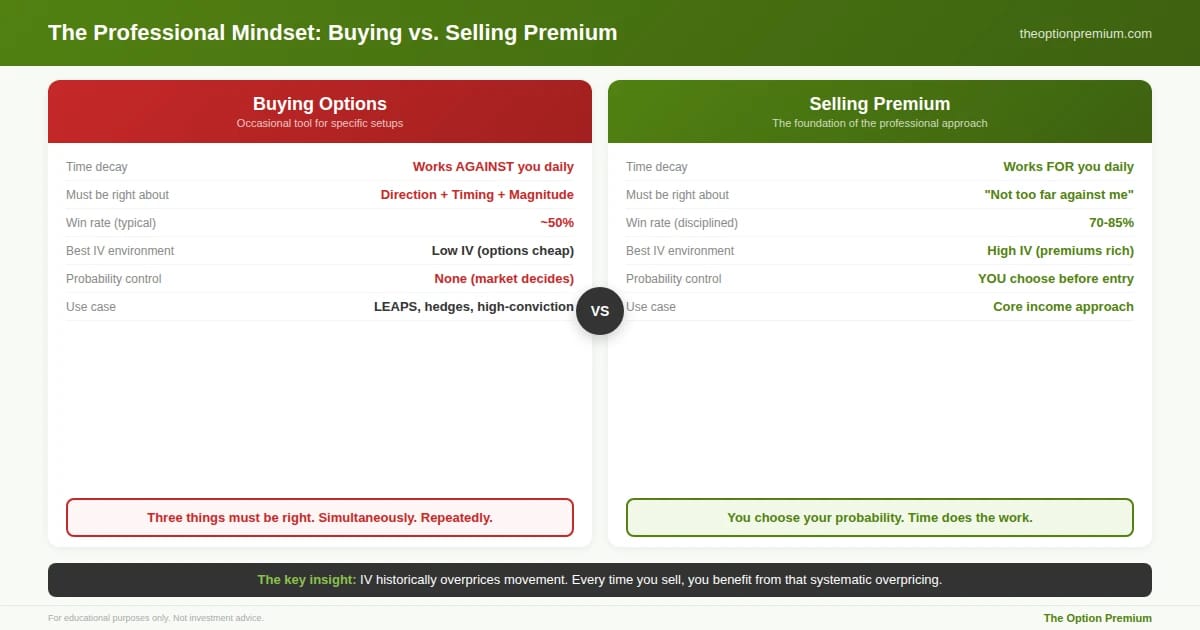
The fundamental divide. Buying options requires being right about direction, timing, and magnitude simultaneously while time decay erodes your position every day. Selling premium flips the equation: time works for you, you choose your own probability of success (typically 70-85%), and IV historically overprices movement, meaning every sale benefits from that systematic overpricing. Buying has its place for LEAPS, hedges, and high-conviction setups. But as the core income-generating approach across 24 years, selling is the foundation.
The Law of Large Numbers: Your Greatest Ally (If You Let It Work)
This might be the most important concept in this entire article. If you absorb nothing else, absorb this.
A typical options trader wins around 50 percent of the time. A disciplined premium seller wins 70 to 85 percent. Now ask yourself: what does that difference mean over a year of trading? Over three years? Over a career?
The Law of Large Numbers says that as your trade count grows, your actual results start converging to your expected win rate. With an 80 percent win rate, hundreds of trades in, the math becomes overwhelmingly in your favor.
But here's where it gets behavioral. And this is where most people blow it.
Variance is completely real. With an 80 percent win rate, you will absolutely lose four trades in a row at some point. It's statistically normal. But your brain doesn't know that. Your brain sees four losses and starts telling you the strategy is broken. And so people quit. Right at the point where the math is about to reassert itself.
It's called sequence risk. Most of us went through the middle-school exercise of flipping a coin ten times, in ten-flip intervals, and totaling it over 100 flips. The first ten flips might produce 7 heads. The second ten might produce 3. The next ten, 6. And so on. But at the end of the experiment, the percentage of heads and tails falls around 50%. It makes perfect sense. We start with a 50% probability of success with each flip, so the Law of Large Numbers tells us the fate of our outcome. We just have to manage the sequence risk along the way.
I've seen this pattern over and over again across 24 years. Traders abandon a statistically sound approach during a completely normal losing streak because they're making decisions emotionally instead of with a probability-based mindset. The strategy worked. The trader stopped it. That's the pattern. Every time.
This is also why the 2 to 5 percent position sizing rule is not optional. It's structural. If you're only risking 2 to 5 percent per trade, a losing streak hurts but it doesn't end you. You stay in the game. You let the Law of Large Numbers work.
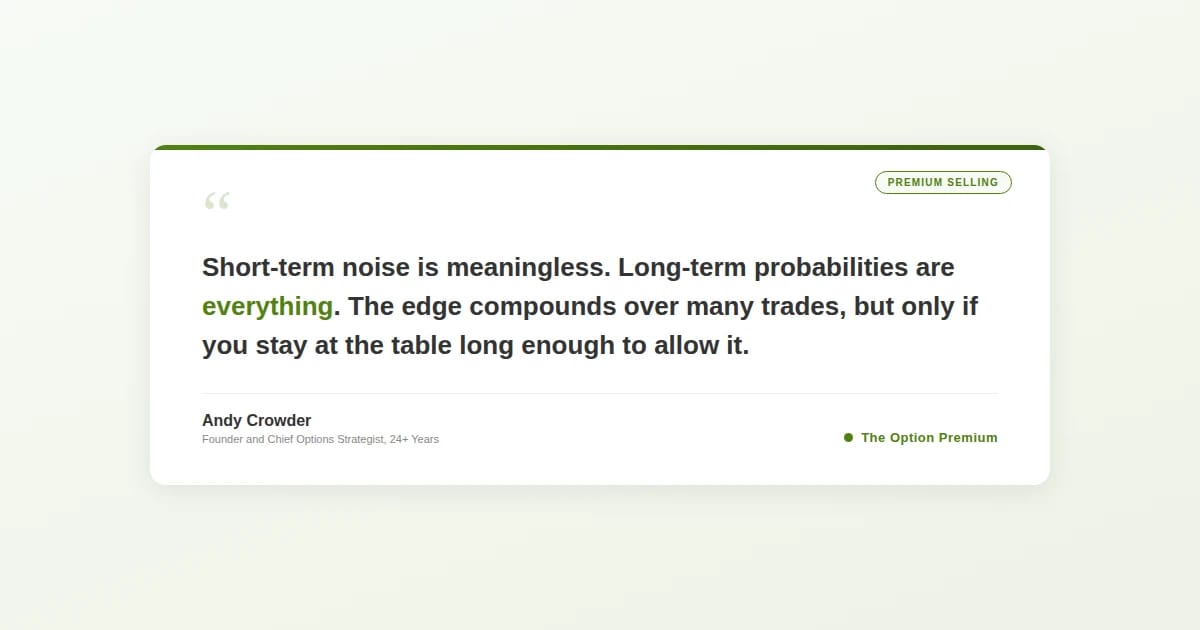
Short-term noise is meaningless. Long-term probabilities are everything. That's not just something I say. It's how a tried and true statistical principle works.
Implied Volatility Is Not a Background Metric
I need you to hear this clearly. Implied volatility is not a little checkbox you glance at before placing a trade. IV is the primary signal that tells you what strategy to use, where to put your strikes, how much premium you can collect, and honestly whether the trade is even worth doing.
When IV is elevated, options are overpriced relative to what usually happens. The market is paying up for protection and speculation. As a seller, that's your opportunity. You collect that overpriced premium, and as volatility reverts to its mean (which it almost always does), that premium collapses in your favor.
When IV is low, options are cheap. The credits are thin. You're accepting the same risk for a fraction of the reward. That math just doesn't work.
And here's where most retail traders get it completely backwards. They see a stock in the news making big moves, lots of excitement, and they try to sell premium into that. But by the time a stock is making headlines, the volatility spike has often already happened and started fading. The moment has passed. You need to be in front of it.
The tools for that are IV Rank and IV Percentile. Without them, implied volatility is just a number with no context.
The Two Numbers That Should Be on Your Screen Before Every Trade
IV Rank tells you where implied volatility is right now relative to its 52-week range. If a stock's IV has ranged between 20 and 40 over the past year and current IV is 34, then IVR = (34 - 20) / (40 - 20) x 100 = 70. That means current IV is in the top 30 percent of its annual range. That's elevated. That's where you want to be as a seller.
IV Percentile asks a slightly different question: over the past 252 trading days, how often has IV been lower than it is today? If IV was lower than today's reading on 182 of those 252 days, then IVP = 182 / 252 x 100 = 72. Also elevated.
Why do you need both? Because IV Rank has a known blind spot. If a stock had one enormous volatility spike 11 months ago and has been completely quiet since, that spike distorts the 52-week range. IV Rank would show current IV as low relative to that extreme high, even if current IV is genuinely elevated relative to the stock's normal behavior. IV Percentile doesn't have that problem because it looks at the distribution of all 252 daily readings, not just the high and low anchors.
My personal minimums: IVR above 35 and IVP above 50 before I even consider a spread. The strongest signal is when both are above 50 and 65 respectively at the same time. When you see that dual confirmation, the case for selling premium is compelling.
The Expected Move: Where Everything Becomes Actionable
The expected move is where everything I've described so far becomes something you can actually trade. It's the bridge between the IV framework and the real position you're going to build.
The formula: Current Price x Implied Volatility x Square Root of (Days to Expiration / 365). That gives you a dollar amount, plus or minus, representing where the market expects the stock to trade roughly 68 percent of the time by expiration.
Let me walk through a real example. SPY around $595. IV around 25 percent. 52 days to expiration. The math: $595 x 0.25 x sqrt(52/365) = approximately $50. The expected move is roughly plus or minus $50. The market is saying there's approximately a 68 percent chance SPY stays between $545 and $645 by expiration.
Now here's the critical part. I place my short strikes outside that range. Not at the boundary. Not inside it. Outside it.
When you place your short put at the lower boundary and your short call at the upper boundary, you're already at roughly 68 percent probability. Most professional sellers push further out, to the 0.15 to 0.20 delta range, which gets you to 80 to 85 percent probability of success.
Think about what you're doing. You're using the market's own consensus estimate, in real time, of what a normal price range looks like, and you're selling premium beyond that consensus. You're getting paid to be in the zone where 80-plus percent of outcomes actually land. That's not guessing. That's turning the market's own pricing into your edge.
And notice the relationship with IV. High IV means a wider expected move, which means your strikes can go further from the current price while still collecting meaningful premium. Low IV means a narrow expected move, your strikes have to get closer, and the risk-reward starts to fall apart. This is why IV and the expected move are always connected, and why IV drives the entire decision tree.
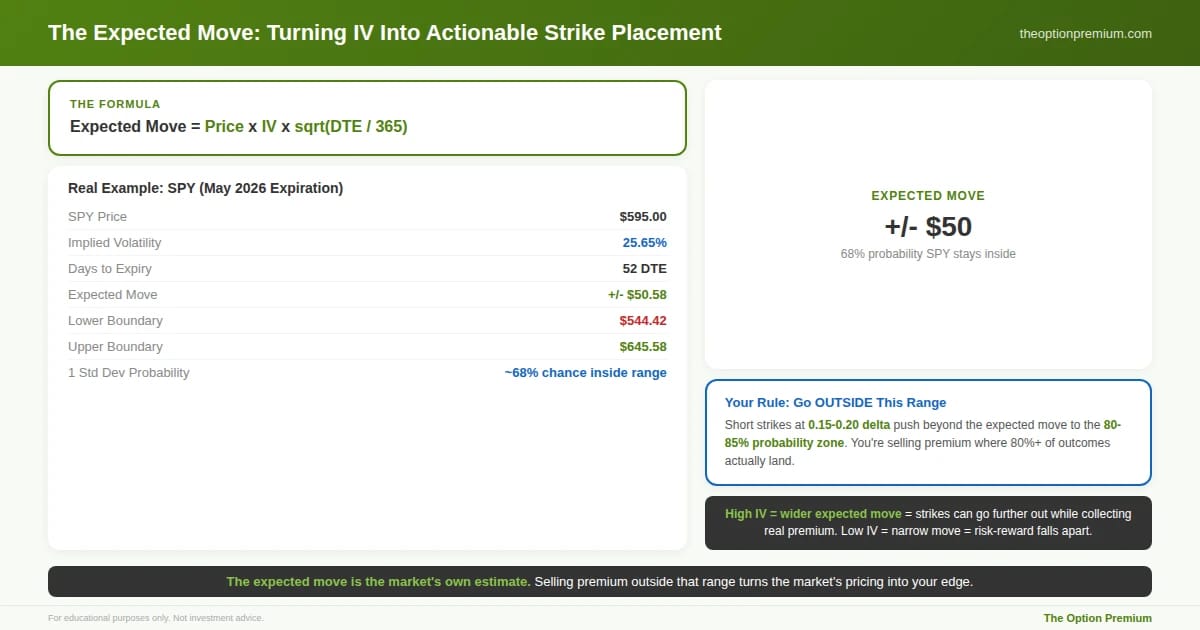
The expected move formula turns implied volatility into actionable strike placement. This real SPY example shows 25.65% IV producing a $50.58 expected move over 52 days. The market is pricing a 68% chance SPY stays between $545 and $645. Professional sellers place short strikes outside this range at the 0.15-0.20 delta level, pushing into the 80-85% probability zone. High IV means a wider expected move, which means strikes can go further out while still collecting meaningful premium. Low IV compresses the range, and the risk-reward falls apart.
The 7-Step Process: How I Find Every Trade
Here's the question I get asked more than any other: "Andy, what's the best stock for a credit spread right now?"
My answer every time: that's the wrong question. The right question is: what process do I run to find the best candidates? Because the answer to "what stock" changes every single week. The process never changes.
Step 1: Liquidity. Tight bid-ask spreads, meaningful open interest, real daily volume. This alone eliminates about 86 percent of all optionable stocks. Wide bid-ask spreads are a hidden tax on every transaction. If the bid-ask is $0.15 wide on each leg of your spread, you're giving back $30 per contract just to get in and out. Over hundreds of trades, that friction destroys your edge.
Steps 2 through 4: Volatility confirmation. Understand the IV environment directionally. Then confirm IV Rank is above 35. Then confirm IV Percentile is above 50. All three need to point the same way before you move forward.
Step 5: Map the expected move. Calculate it for the specific stock and expiration. This defines your strike field.
Step 6: Strategy selection. High IV? You're selling. Bull put spread if you're mildly bullish or neutral. Bear call spread if you're neutral to bearish. Iron condor if you're fully neutral. Low IV? The premiums rarely justify the risk.
Step 7: Strike selection. Target the 0.15 to 0.30 delta range, outside the one standard deviation expected move. That's your 70 to 85 percent probability zone.
The process is the answer. Always. The stock name is just what comes out the other end.
Access My Weekly Watchlists at: The Implied Perspective
Credit Spreads: How They Work With Real Dollars
A bull put spread is a bullish or neutral position. You sell a put at a higher strike and buy a put at a lower strike, both in the same expiration. You collect a net credit upfront. Your max profit is that credit. Your max loss is the spread width minus the credit.
A bear call spread is the mirror. Sell a call at a lower strike, buy a call at a higher strike. Collect a credit. Profit as long as the stock stays below your short strike.
Stock at $100. On the put side, you sell the $95 put for $2.00 and buy the $90 put for $0.50. Net credit: $1.50 ($150 per spread). Max loss: $3.50 ($350 per spread). Breakeven: $93.50. You're profitable as long as the stock is anywhere above $93.50 at expiration. That's a 6.5% cushion below the current price.
On the call side, same stock. Sell the $105 call for $2.00, buy the $110 call for $0.60. Net credit: $1.40. Max loss: $3.60. Profitable below $106.40.
Both structures are defined risk. You know exactly what you can lose before you click the button. That's the foundation of how professionals manage capital.
But I want to say something here that people gloss over. Having defined risk on paper doesn't protect you. The discipline to follow your management rules is what actually makes the structure work. Which brings us to the rulebook.
The Rulebook
These rules are not suggestions. They are what turns a technically sound setup into actual consistent results over time.
Delta target. 0.15 to 0.30 on the short strike. That's your 70 to 85 percent probability zone. The short strike goes outside the one standard deviation expected move. Not at it. Outside it.
DTE sweet spot. 30 to 60 days. This is where theta decay begins to accelerate meaningfully while gamma remains manageable. You're capturing the steepest part of the decay curve without the wild probability swings that come with holding positions too close to expiration.
Spread width. $5 wide on the big liquid ETFs. $2 wide for smaller accounts. $10 wide for larger accounts. Attempt to collect at least one-third of the spread width. On a $5-wide spread, that means $1.65 or more.
Profit target. Close the position when you've captured 50 percent of the credit. Collected $1.00? Buy it back at $0.50. Lock in the real gain and free up capital for the next trade. On a well-placed spread in elevated IV, this often happens in 10 to 15 days. Don't get greedy for the back half.
Stop loss. If the spread reaches two to two-and-a-half times the original credit, you close it. Full stop. Collected $1.00? If it's now worth $2.00 to $2.50, exit. No hoping. No waiting for a reversal.
The 21 DTE rule. At 21 days to expiration, every open position gets a deliberate review. Profitable ones should probably be closed. Losing ones need a concrete decision, not drift.
The 10 DTE rule. Almost without exception, you exit at 10 days to expiration. Gamma accelerates hard in those final two weeks. In most cases, I just get out.
Pre-entry checklist. Before any trade: Is the max loss tolerable? Do you have a written profit target and a written stop loss? Is there an earnings announcement inside this expiration cycle? If you can't answer those questions clearly, you don't place the trade.
Position sizing is the most important decision you make. Risk no more than 2 to 5 percent of your account on any single spread.
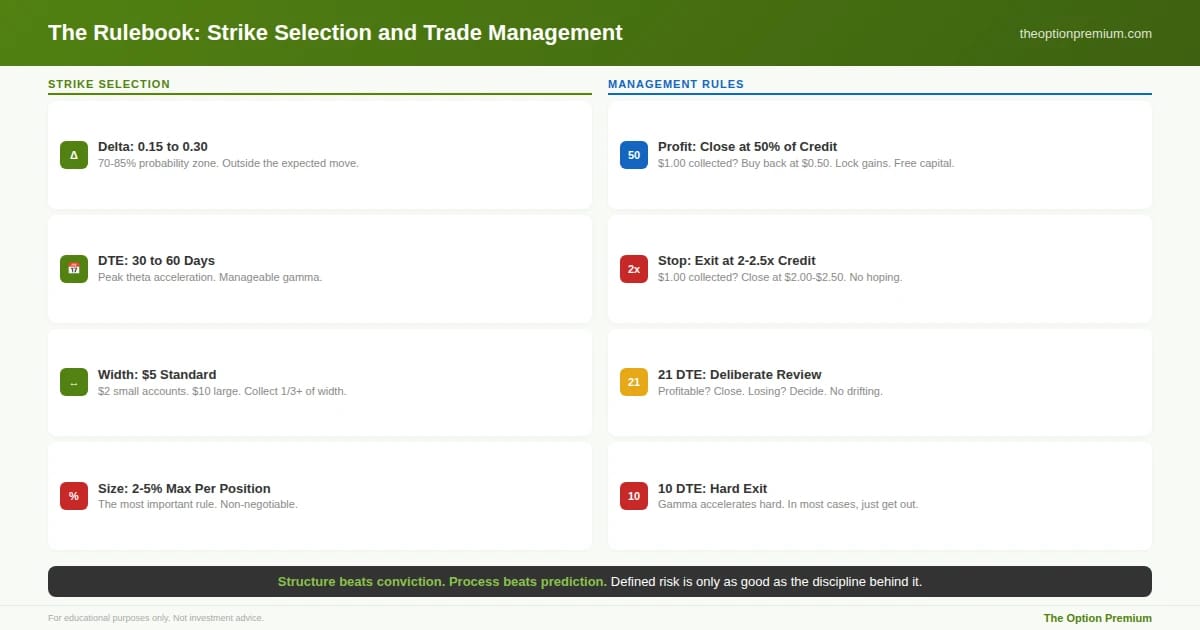
The complete rulebook that turns a technically sound setup into consistent results. Strike selection: 0.15-0.30 delta outside the expected move, 30-60 DTE, $5 wide on liquid ETFs, collect at least 1/3 of width, 2-5% max per position. Management: close at 50% of credit (collected $1.00, buy back at $0.50), stop at 2-2.5x credit, deliberate review at 21 DTE, hard exit at 10 DTE as gamma accelerates. Position sizing is the most important rule. Non-negotiable.
Iron Condors: Collecting From Both Sides
An iron condor is just two credit spreads combined. A bull put spread below the current price, a bear call spread above it. You collect from both sides, and you profit when the stock stays within the range you've defined.
Stock at $200. Sell the $190 put, buy the $185 put, sell the $210 call, buy the $215 call. Total credit: $2.00 per condor. Profit zone: $190 to $210. Breakevens: $188 and $212. Max loss: $300 per side.
Three things need to be right. First, your outlook has to be genuinely neutral. No strong trend, no upcoming catalyst. The stock just needs to breathe. Second, IV Rank needs to be above 35 at minimum. You need rich enough premium on both wings to make the two-sided structure worth it. Third, no earnings inside your expiration window. An earnings announcement can gap the stock through your strikes overnight with zero chance to manage.
Stocks spend far more time doing nothing than making dramatic moves. Look at any chart. The iron condor is how you get paid for that reality.
Management comes down to four decisions. Take profit at 50 percent (collected $2.00, close at $1.00 or less). Roll the untested side closer if the stock makes a temporary move toward one wing, collecting an extra $0.30 to $0.50. Close just the losing side if the move is sustained, rather than holding both sides under pressure. And exit before maximum loss, closing everything if the stock approaches your long strike. I tend to exit when the premium reaches twice my original credit.
Always think in total maximum loss dollars, not per-condor. Ten condors at $300 max loss each is $3,000 of real exposure. Always count in totals.
Earnings Plays: Selling the Uncertainty Before It Resolves
Earnings season is when most retail traders either blow up trying to predict the reaction or sit on the sidelines and watch the opportunity pass. The professional approach flips the entire dynamic.
In the week or two before earnings, implied volatility builds steadily. Traders are buying options for protection, for speculation, for hedging. That's real, measurable premium inflation. Then, within hours of the release, regardless of whether the company beat or missed, IV collapses. The uncertainty is gone. The premium those buyers paid just evaporates. This is the IV crush.
Instead of buying options to bet on direction, you sell the premium that nervous buyers are inflating. Five steps, every single time. Liquidity first. IV confirmation (IVR above 35, IVP above 50). Expected move mapping with short strikes outside the range. Historical behavior check over the last 8 to 12 earnings cycles. And sizing at 2 to 5 percent of your earnings allocation with 80 percent or better probability each side.
Let me make this completely concrete. Visa at $217.79. Expected move: plus or minus $10, putting the one standard deviation range at $207.50 to $227.50.
Call side: sell the $232.50, buy the $237.50. Five dollars wide, short call sitting $5 above the upper boundary. Probability of expiring out of the money: 88.34 percent. Put side: sell the $195, buy the $190. Short put $12.50 below the lower boundary. Probability out of the money: 91.24 percent.
Combined credit: $0.67 per condor. Margin: $433. Return on capital: 15.5 percent. On a trade that resolves in one to two trading days.
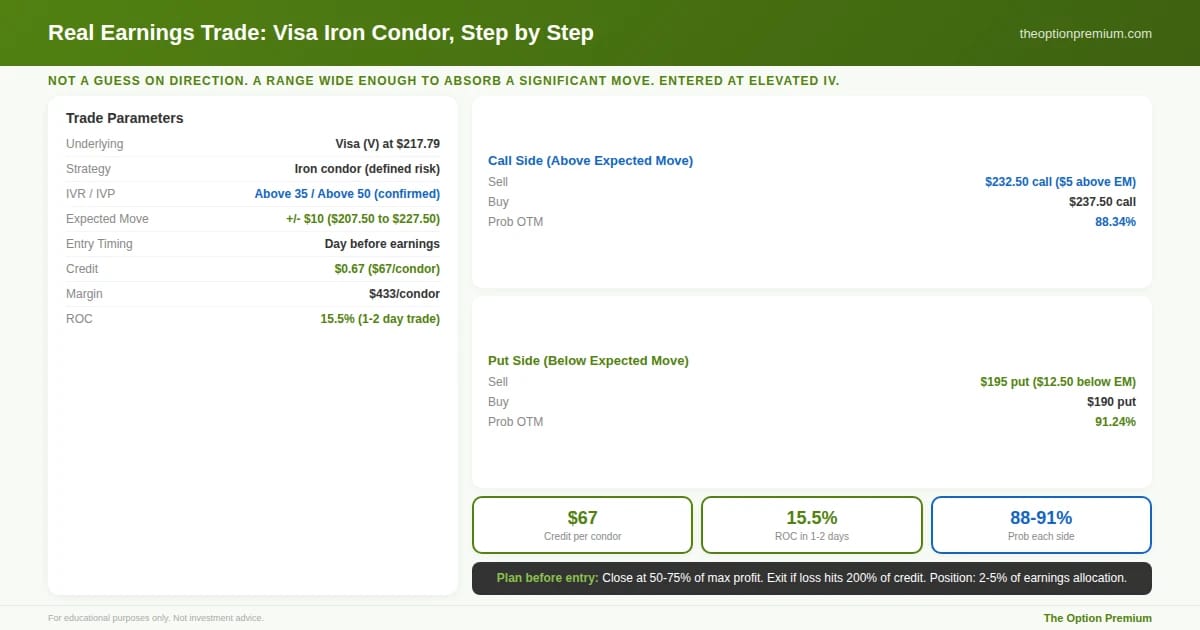
A professional earnings trade with real numbers. Visa at $217.79, expected move of plus or minus $10. The call side sits $5 above the expected move boundary (88.34% probability OTM). The put side sits $12.50 below (91.24%). Combined credit: $0.67 per condor on $433 margin, 15.5% ROC on a trade that resolves in 1-2 trading days. Management plan written before entry: close at 50-75% profit, exit at 200% of credit, 2-5% of earnings allocation maximum. Not a guess on direction. A range wide enough to absorb a significant move.
Management plan written before entry: close at 50 to 75 percent of max profit, exit if loss hits 200 percent of credit, position limit of 2 to 5 percent of the earnings allocation.
That's a professional earnings trade. Not a guess on whether Visa beats or misses. A range wide enough to absorb a significant move in either direction, entered at elevated IV, with a clear plan before the order ticket is touched. Earnings trades are not about predicting the news. They're about building a range wide enough to survive being wrong and getting paid while the crowd inflates option prices through the uncertainty.
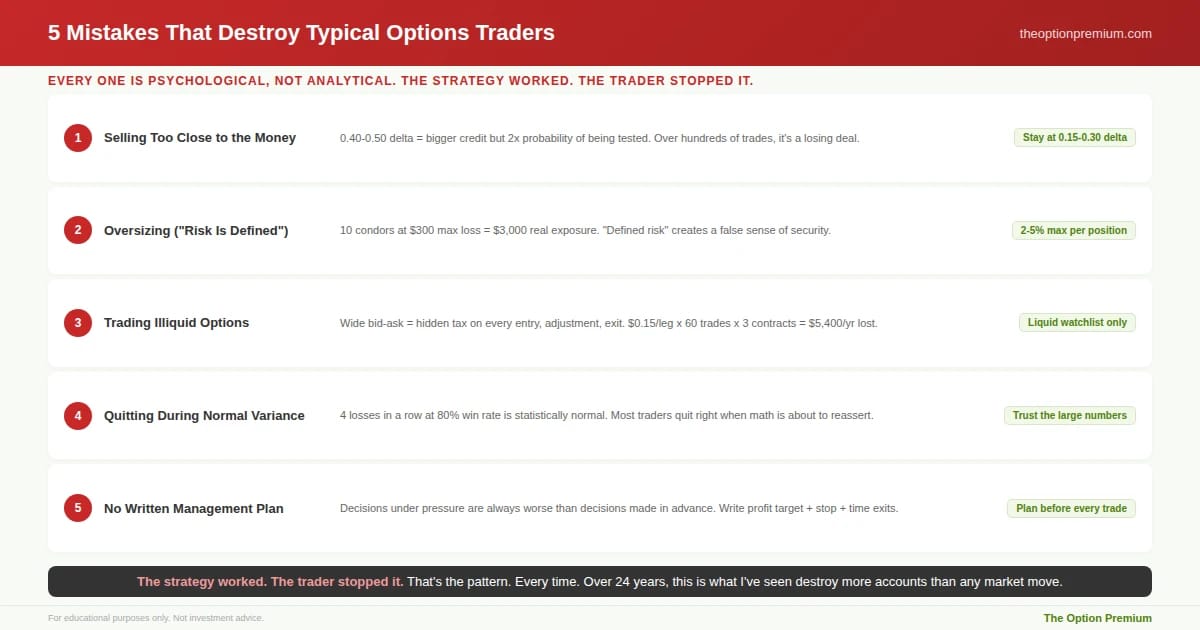
The Five Mistakes That Destroy Traders
Every single one of these is psychological, not analytical.
Selling too close to the money. The 0.40 to 0.50 delta strike looks great because the credit is bigger. But you're accepting roughly twice the probability of being tested, with far less room to breathe. Over hundreds of trades, the Law of Large Numbers works against you instead of for you. Stay at 0.15 to 0.30 delta. The compounding effect of a 75-85% win rate over time is far more powerful than the occasional large credit that comes with a coin-flip probability.
Oversizing because the risk is defined. The most dangerous mistake. "Defined risk" gives traders a false sense of security. They see the max loss on a single condor and think it's manageable. Then they put on ten. That's $3,000 of real exposure. One bad earnings gap and you feel it deeply. No single position should ever be existential to your account.
Trading illiquid options. Wide bid-ask spreads are a hidden tax on every transaction. If the bid-ask is $0.15 wide on each leg, you're donating $0.30 per contract every time you touch the position. Over 60 trades a year with 3 contracts each, that's $5,400 in friction that never shows up on your P&L but absolutely degrades your results. Stick to the liquid names.
Abandoning the strategy during normal variance. Four losses in a row at an 80 percent win rate is completely normal statistically. But it doesn't feel normal. And so people quit right when the math is about to reassert itself. I've seen this pattern destroy more accounts than any market move ever could. The strategy worked. The trader stopped it. The cure is understanding that sequence risk is a mathematical reality, not a signal that the approach is broken. You manage it with position sizing, and you survive it with patience.
No written trade management plan. Every decision you make while a losing trade is moving against you is worse than the same decision made in advance under calm, rational conditions. Profit target at 50 percent. Stop loss at 2 to 2.5 times credit. Review at 21 DTE. Hard exit at 10 DTE. These decisions, made before the trade, are always better than the same decisions made under emotional pressure.
Risk Reality Check
Nothing in this article is a guarantee. An 80 percent win rate still means 20 percent of your trades lose, and those losses can cluster in ways that feel devastating even when they're statistically normal. Every trade can go against you. The expected move can be exceeded. The market can gap through your strikes overnight.
What makes this approach work over time is not any single trade. It's the combination of high-probability entries, disciplined management with written rules, conservative position sizing, and the patience to let the Law of Large Numbers do what it does across hundreds of trades. The math rewards consistency. It punishes impatience. And the traders who survive long enough to let the edge compound are the ones who treated position sizing as the most important decision they make, not the most boring one.
Key Takeaways
Professional options traders sell premium as their core approach because time decay works in the seller's favor every day, IV historically overprices movement, and sellers choose their own probability of success before each trade. Buying has its place, but selling is the foundation that has sustained the professionals I've known across 24 years.
The Law of Large Numbers is your greatest ally, but only if you let it work. With an 80% win rate and 2-5% position sizing, the math becomes overwhelmingly positive over hundreds of trades. Four consecutive losses is statistically normal, not a signal that the strategy is broken. The traders who survive the losing streaks and stay at the table are the ones who compound.
IV Rank and IV Percentile should be on your screen before every trade. IVR above 35 and IVP above 50 are the minimums. Both elevated together is the strongest signal. Without these metrics, implied volatility is a number with no context, and you have no way to know whether the premium is worth selling.
The expected move formula turns IV into actionable strike placement. Place short strikes outside the one standard deviation range at the 0.15 to 0.20 delta level for 80-85% probability of success. The 7-step process (liquidity, IV direction, IVR, IVP, expected move, strategy, strike selection) never changes. The stock name is just what comes out the other end.
The management rulebook is what turns a sound setup into consistent results: 30-60 DTE entry, 50% profit target, 2-2.5x stop loss, 21 DTE review, 10 DTE hard exit, 2-5% per position, written plan before entry. Defined risk is only as good as the discipline behind it. Structure beats conviction. Process beats prediction.
The edge in options trading doesn't come from predicting where the market is going. It comes from understanding the probabilities, structuring trades that put those probabilities in your favor, managing positions with written rules, and having the patience to let the Law of Large Numbers compound your results over time. That's the whole approach. Everything in this article is a structured application of that one idea. And that’s the foundation of everything I teach within The Implied Perspective.
Andy Crowder
📩 Want to see how a 24+ year professional options trader approaches the market?
Subscribe to The Option Premium, my free weekly newsletter where I share:
Probability-based strategies that actually work: credit spreads, cash-secured puts, the wheel, LEAPS, poor man's covered calls, and more
Real trade breakdowns with the math behind every decision
Market insights for any environment, whether we're grinding higher, pulling back, or chopping sideways
No hype. No predictions. Just the frameworks I've used to trade options for over two decades.
📺 Want more? Follow me on YouTube for in-depth tutorials, live trade analysis, and the kind of education you won't find anywhere else.
Connect with me:
This newsletter is for educational purposes only and should not be considered investment advice. Options trading involves significant risk and is not suitable for all investors. Past performance does not guarantee future results. Always consult with a qualified financial professional before making investment decisions.
Reply