- The Option Premium
- Posts
- Options Traders' Must-Have: Mastering the Expected Move
Options Traders' Must-Have: Mastering the Expected Move
Learn how to calculate the expected move using implied volatility, place strikes outside the range, and build high-probability credit spreads with real SPY examples.

The Expected Move: Every Options Trade Starts Here
Most options traders spend their time focused on which direction a stock will move. That's the wrong question. The more useful question is: how far is it likely to move, regardless of direction? That single number, the expected move, changes how you select strikes, size positions, and evaluate whether a trade is worth placing in the first place. After 20 years of options trading, it's the first thing I pull up before I touch any position.
What the Expected Move Actually Tells You
The expected move is the market's best estimate of how far an underlying asset will travel, up or down, over a specific time period. It's derived directly from implied volatility and expressed as a price range around the current price.
A few things worth understanding clearly before going further:
It's a probability range, not a prediction. The expected move defines a one-standard-deviation range, which means the underlying asset will land inside that range roughly 68% of the time by expiration. Not 100%. Not even close. That 32% of the time it lands outside the range is exactly the risk you're managing when you place strikes around it.
It has no directional bias. The calculation treats an upside move and a downside move identically. The expected move is plus or minus a number, not a lean in either direction.
Implied volatility drives the magnitude. When IV is elevated, the expected move expands. When IV is compressed, it shrinks. That's why the same stock can have a $5 expected move during a quiet period and a $15 expected move heading into earnings. The market is pricing in more uncertainty, and the expected move reflects that.
Time shrinks it. Expected move decreases as expiration approaches. A 60-day expected move is larger than a 30-day expected move on the same underlying with the same IV, because there's more time for the price to travel.
How to Calculate the Expected Move
The formula is straightforward:
Expected Move = Current Price x Implied Volatility x square root of (Days to Expiration / 365)
Let me show you exactly how this works using SPY, with a real options chain example.
Parameters:
SPY current price: $595.36
Implied volatility: 13.52%
Days to expiration: 46 (February 21, 2025 expiration)
Step 1: Calculate the time factor. Square root of (46 / 365) = approximately 0.354.
Step 2: Multiply through. $595.36 x 0.1352 x 0.354 = approximately $28.50.
The expected move is plus or minus $28.50.
That means, by February 21, 2025, SPY is statistically expected to trade within:
Lower bound: $566.86 ($595.36 minus $28.50)
Upper bound: $623.86 ($595.36 plus $28.50)
About 68% of the time, SPY will close somewhere in that $566.86 to $623.86 range by expiration. Roughly one in three occurrences, it will land outside it.

SPY at $595.36, IV 13.52%, 46 DTE. Expected move of plus or minus $28.50 gives a range of $566.86 to $623.86.
SPY at $595.36, IV 13.52%, 46 DTE. Expected move of plus or minus $28.50 gives a range of $566.86 to $623.86.

1 SD covers 68% of outcomes. 2 SD covers 95%. Knowing which zone your strikes occupy tells you the real probability of success before you place the trade.
1 SD covers 68% of outcomes. 2 SD covers 95%. Knowing which zone your strikes occupy tells you the real probability of success before you place the trade.
Why This Changes Your Strike Selection
Once I have the expected move, I know where the market has priced the one-standard-deviation boundary. My short strikes go outside that boundary, not at it or inside it.
Here's the logic. Option buyers are paying elevated premium inside and near the expected move, because that's where they expect price action to happen. If I sell strikes near the current price or at the expected move boundary, I'm collecting premium, but I'm also accepting meaningful probability of being tested or breached. The trade becomes a directional bet in disguise.
By placing short strikes beyond the expected move, I'm positioning in a zone the market has priced as low probability. That's where the math works in favor of premium sellers consistently over time, because the crowd is overpaying for protection closer to the money while I'm collecting premium at the statistical edges.
This approach is the foundation of credit spread and iron condor construction. The expected move gives you the anchor point, and your strike selection starts from there.
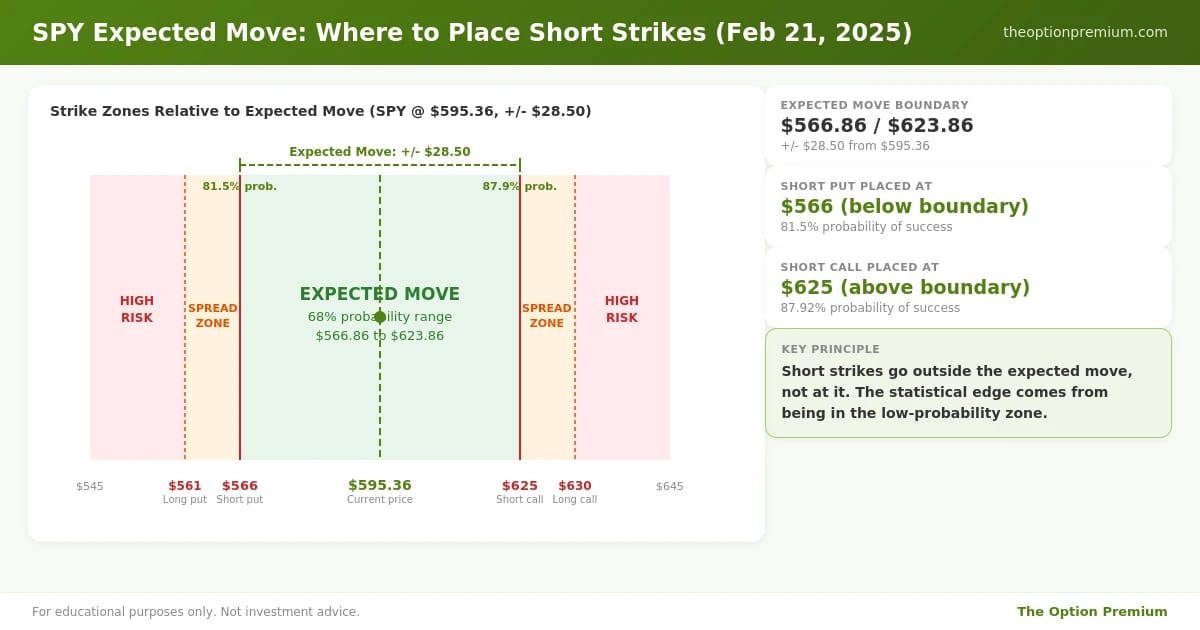
Short strikes placed outside the expected move range give higher probability of success. The $566 put and $625 call both sit beyond the $28.50 boundary.
Short strikes placed outside the expected move range give higher probability of success. The $566 put and $625 call both sit beyond the $28.50 boundary.
Putting It to Work: Two Real Trade Examples
Here's how the expected move translates into actual positions, using the same SPY setup.
Bullish Setup: Bull Put Spread Below the Expected Move
With the lower expected move boundary at $566.86, a bullish trader using a defined-risk structure would look at put spreads below that level. Selling the $566 put and buying the $561 put for protection creates a 5-point-wide bull put spread that sits just outside the lower boundary.
Trade details:
Short put strike: $566 (just below $566.86 expected move boundary)
Long put strike: $561
Credit received: approximately $0.50 ($50 per spread)
Margin required: $450
Return on capital: 11.1%
Probability of success: 81.5%
Probability of touch (short strike reached at any point before expiration): 37.8%
The 81.5% probability means that in roughly 4 out of 5 occurrences, SPY closes above $566 by February 21 and the spread expires worthless. The premium collected is kept in full. Note that the probability of touch is 37.8%, which is considerably higher than the probability of the spread expiring in the money. A touch doesn't equal a loss, but it does mean the position will be tested at some point before expiration more than one-third of the time.
Bearish Setup: Bear Call Spread Above the Expected Move
On the upside, with the upper boundary at $623.86, a bearish or neutral trader would look at call spreads above that level. Selling the $625 call and buying the $630 call creates a 5-point-wide bear call spread sitting just outside the upper boundary.
Trade details:
Short call strike: $625 (just above $623.86 expected move boundary)
Long call strike: $630
Credit received: approximately $0.58 ($58 per spread)
Margin required: $442
Return on capital: 13.1%
Probability of success: 87.92%
Probability of touch: 23.25%
The call side shows a higher probability of success than the put side in this example, reflecting an asymmetry in the options market. That's common. The two sides of the expected move don't always price symmetrically, particularly when the market has a directional lean embedded in the skew. The delta at each strike tells you this directly: the $625 call sits further out of the money in probability terms than the $566 put does, despite being equidistant in dollar terms from the current price.

Bull put spread at 566/561 (81.5% probability, 11.1% ROC) vs. bear call spread at 625/630 (87.92% probability, 13.1% ROC). Both placed outside the expected move boundary.
Bull put spread at 566/561 (81.5% probability, 11.1% ROC) vs. bear call spread at 625/630 (87.92% probability, 13.1% ROC). Both placed outside the expected move boundary.
How I Actually Use This in Practice
The expected move is my starting point on every single trade, not an afterthought. Here's how I work through it:
Before I look at specific strikes, I pull the expected move for the expiration cycle I'm targeting. For most premium selling strategies, I'm working in the 30 to 45 DTE range where theta decay is most efficient. I calculate or look up the expected move for that cycle, mark the upper and lower boundaries, and then begin evaluating strike placement from there.
My default is to place short strikes one standard deviation out or further. The 0.15 to 0.25 delta range is my target zone for short strikes, which corresponds to roughly 75 to 85% probability of expiring worthless. These strikes usually fall near or just outside the one-standard-deviation expected move boundary, which is exactly where I want to be.
When IV is elevated, the expected move expands and the strikes I can sell at 0.20 delta are further from the current price in dollar terms. That's a good thing: I'm getting paid more premium per unit of distance from the stock price. When IV is compressed, the expected move narrows, the premium dries up, and I often skip the trade entirely if the credit doesn't justify the risk.
I also use the expected move to evaluate whether a setup makes intuitive sense. If I'm looking at a stock trading at $100 with an expected move of plus or minus $3, and someone suggests selling the $90 put, I want to understand why I'm going five standard deviations away when I don't need to. The expected move calibrates my intuition about what's near and what's far.
For position sizing, the expected move matters here too. If a position is sitting inside the expected move, it deserves more attention and a tighter management plan. If it's well outside the expected move and time decay is working in my favor, I can be more patient.
Risk Reality Check
The expected move is a probability tool, not a guarantee. One-standard-deviation means 68%, which also means 32% of expirations will land outside the range. That's not a rare event. It happens roughly one in three times, and in a portfolio of positions, you'll see it regularly.
A few things to keep in mind:
The expected move is backward-looking input with forward uncertainty. Implied volatility is derived from current options pricing, which reflects what traders are collectively expecting. It can be wrong, sometimes drastically, especially around earnings, Fed announcements, or unexpected macro events.
Probability of touch vs. probability of expiration are different. The 81.5% probability of success on the $566 put spread means the spread has an 81.5% chance of expiring worthless. The 37.8% probability of touch means the price will hit $566 at some point before expiration more than a third of the time. Knowing the difference matters for managing open positions.
Wider expected moves require wider strikes for the same probability. This sounds obvious, but it has real capital implications. When IV doubles, the expected move roughly doubles, which means you need to go much further from the money to achieve the same 0.20 delta. That's more capital tied up per position and more position sizing discipline required.
The expected move doesn't tell you where the stock will be. It tells you where it's likely to be, based on current market pricing. Using it as a static boundary rather than a probabilistic reference is where traders get into trouble.
Key Takeaways

The expected move defines the one-standard-deviation range where the underlying has a 68% probability of closing by expiration. It's not a guarantee or a price target. It's a probability anchor that tells you where the market has priced the most likely outcome and, just as importantly, where it hasn't.
Implied volatility is the input that drives the expected move's magnitude. When IV is elevated, the expected move expands and premium sellers can sell further out of the money for the same probability. When IV is compressed, the expected move shrinks and credits become thin. Checking IV Percentile before relying on the expected move is essential.
Short strikes placed outside the expected move boundary give you a statistical edge on every position. The crowd overpays for protection inside and near the expected move. Selling premium at the edges, where the market prices lower probability, is where the math works consistently in your favor over time.
The probability of touch and the probability of expiration are not the same number, and confusing them will distort your risk management. The $566 put spread has an 81.5% chance of expiring worthless and a 37.8% chance of SPY touching $566 before expiration. Understanding this distinction is what separates patient traders from those who panic out of positions unnecessarily.
The expected move is the starting point, not the finishing point. Every trade I make begins with this calculation. From there I evaluate IV conditions, strike selection, spread width, and return on capital. The expected move anchors all of it.
The market tells you its best guess every time you look at an options chain. The expected move is that guess, rendered in dollars and probabilities. Learn to read it before you place a single trade.
Andy Crowder
📩 Want to see how a 24+ year professional options trader approaches the market?
Subscribe to The Option Premium, my free weekly newsletter where I share:
Probability-based strategies that actually work: credit spreads, cash-secured puts, the wheel, LEAPS, poor man's covered calls, and more
Real trade breakdowns with the math behind every decision
Market insights for any environment, whether we're grinding higher, pulling back, or chopping sideways
No hype. No predictions. Just the frameworks I've used to trade options for over two decades.
📺 Want more? Follow me on YouTube for in-depth tutorials, live trade analysis, and the kind of education you won't find anywhere else.
Connect with me:
This newsletter is for educational purposes only and should not be considered investment advice. Options trading involves significant risk and is not suitable for all investors. Past performance does not guarantee future results. Always consult with a qualified financial professional before making investment decisions.
Reply