- The Option Premium
- Posts
- 📩 The Option Premium Weekly Issue - March 8, 2026
📩 The Option Premium Weekly Issue - March 8, 2026
Oil Broke Records. Payrolls Broke Negative. The Premiums Have Never Been Richer. 9 ETFs Above 50% IV Rank. The Sell Zone Just Tripled. The VIX Jumped 50%. Here's Where the Math Points Now...and a New Section, "The Research Desk"
Weekly Options Intelligence | March 8, 2026
“Longer Than I Thought"
I want to be honest about something. Building this has taken longer than I thought it would.
When I started The Option Premium, I figured if the strategies were real and transparent and the education was honest, the rest would take care of itself. And it has, just slower than I imagined. No ads, no affiliates, no marketing budget, no BS. Just this newsletter, the track record, the education and word of mouth.
Over 300 of you have joined a paid service along the way. I don't take that lightly. Every one of you took a chance on someone with 24+ years of professional options trading experience who decided to build something different. Something without the hype, without the shortcuts, without the empty promises that saturate this space.
For anyone curious about what's behind the paywall: the Income Foundation ($9/month) is the Wheel strategy on diversified stocks from dividend aristocrats to high-beta growth names. Wealth Without Shares ($49/month) runs five PMCC portfolios with every trade shared in real time. The Implied Perspective ($129/month) is the full volatility intelligence suite behind the Implied Truth, including credit spread and iron condor frameworks on ETFs and equities, again, all shared in real time. All three bundle for $149/month, and annual plans bring each one down.
One thing I want to mention: anyone on the $1,495 annual all-access plan gets every course I release included at no extra cost. That includes the PMCC Mastery course launching soon, and every course that follows it. I wanted the people most committed to their education to never have to think twice about whether they can afford the next resource.
I'm also working on monthly live webinars for paid subscribers, video walkthroughs, and a community platform. When those are ready, prices will need to reflect the added value. Anyone who joins now, at today's prices, keeps that rate for life. The same promise I made to the first 300, I'm making to you.
Thank you for reading. Whether you're a paid member or someone who looks forward to this email every Sunday evening, I'm truly grateful you're here.
Andy Crowder
Founder and Chief Options Strategist, The Option Premium
🎓 Coming Soon: PMCC Mastery
PMCC Mastery covers everything: LEAPS selection, short call management, the roll decisions that separate sustainable income from frustrating losses. This isn't a strategy overview. It's a complete implementation system with clear rules, real examples, and the decision frameworks I use every week in our live portfolios.
You won't be left alone with a PDF. Every student joins the dedicated PMCC community forum for questions, real-time discussion, and accountability to a process that works.
Following PMCC Mastery:
Credit Spreads: The Probability Player's Edge
The Complete Wheel Strategy Course
Want early access? Reply to this email with "PMCC" in the subject line to [email protected]. I'll make sure you're first in line.
📰 What the Data Said This Week
The U.S. and Israel launched coordinated strikes on Iran last weekend in what the Pentagon called "Operation Epic Fury." Markets opened Monday down over 1%, then staged a remarkable intraday recovery to close nearly flat. That resilience lasted until Friday. By the time the week ended, the recovery was gone and so was any remaining complacency.
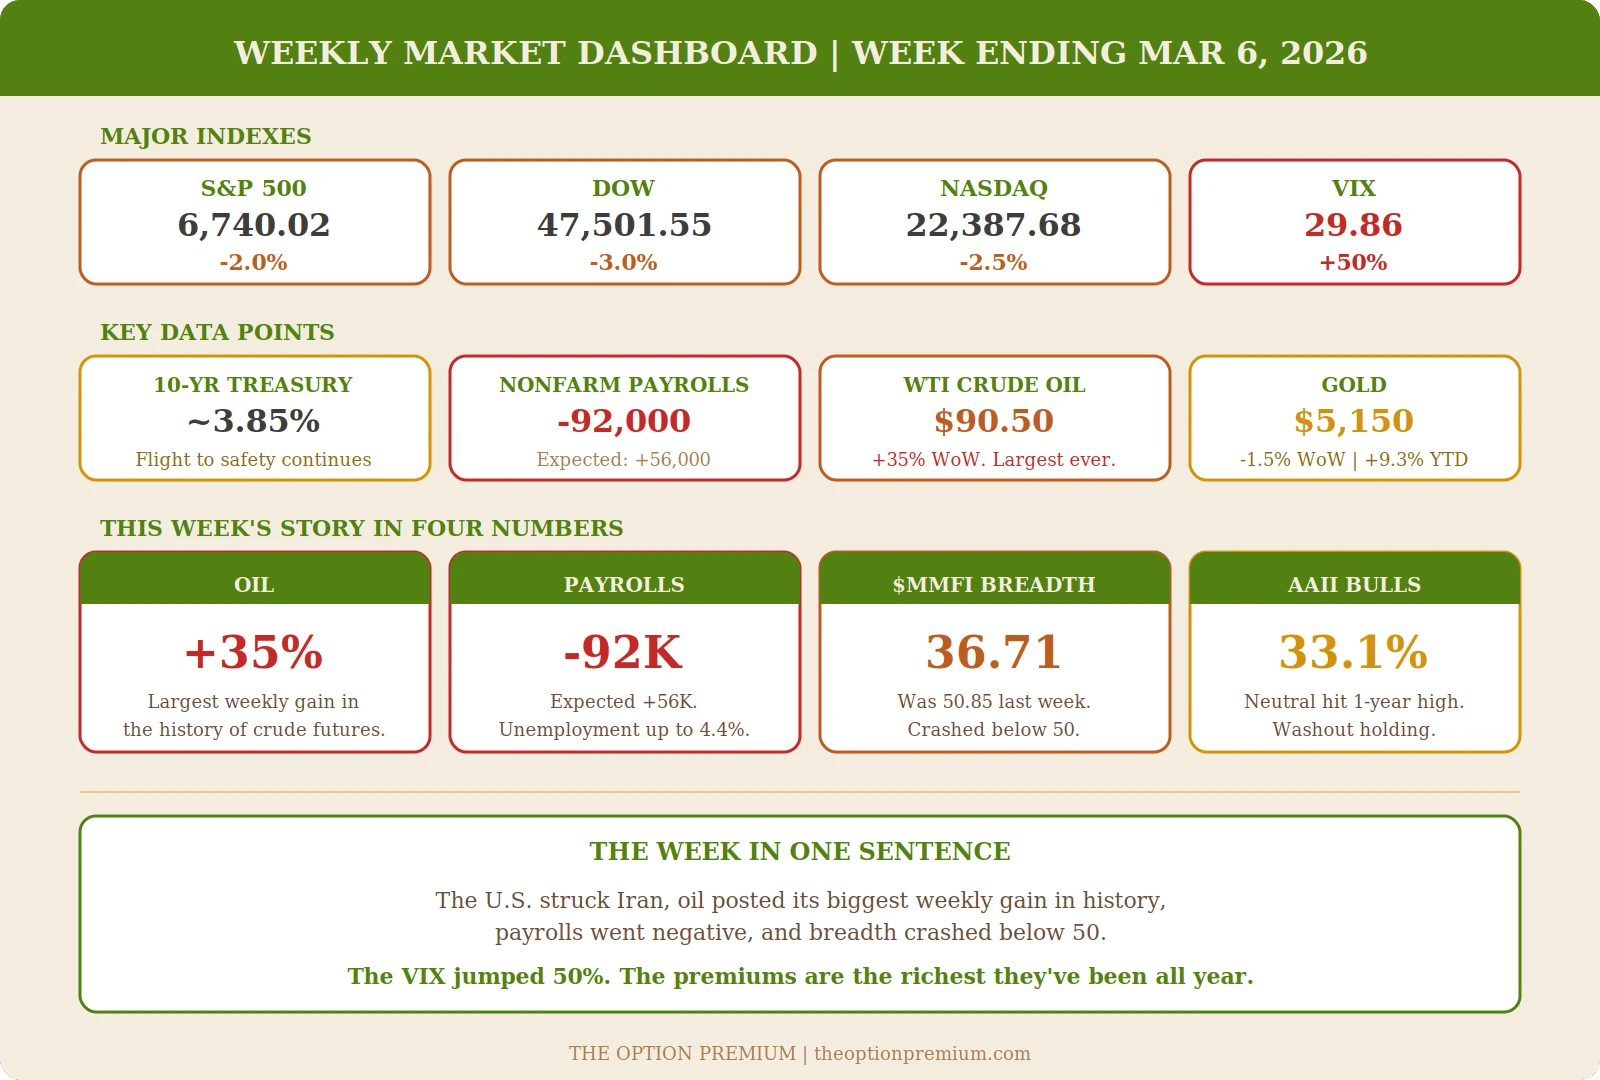
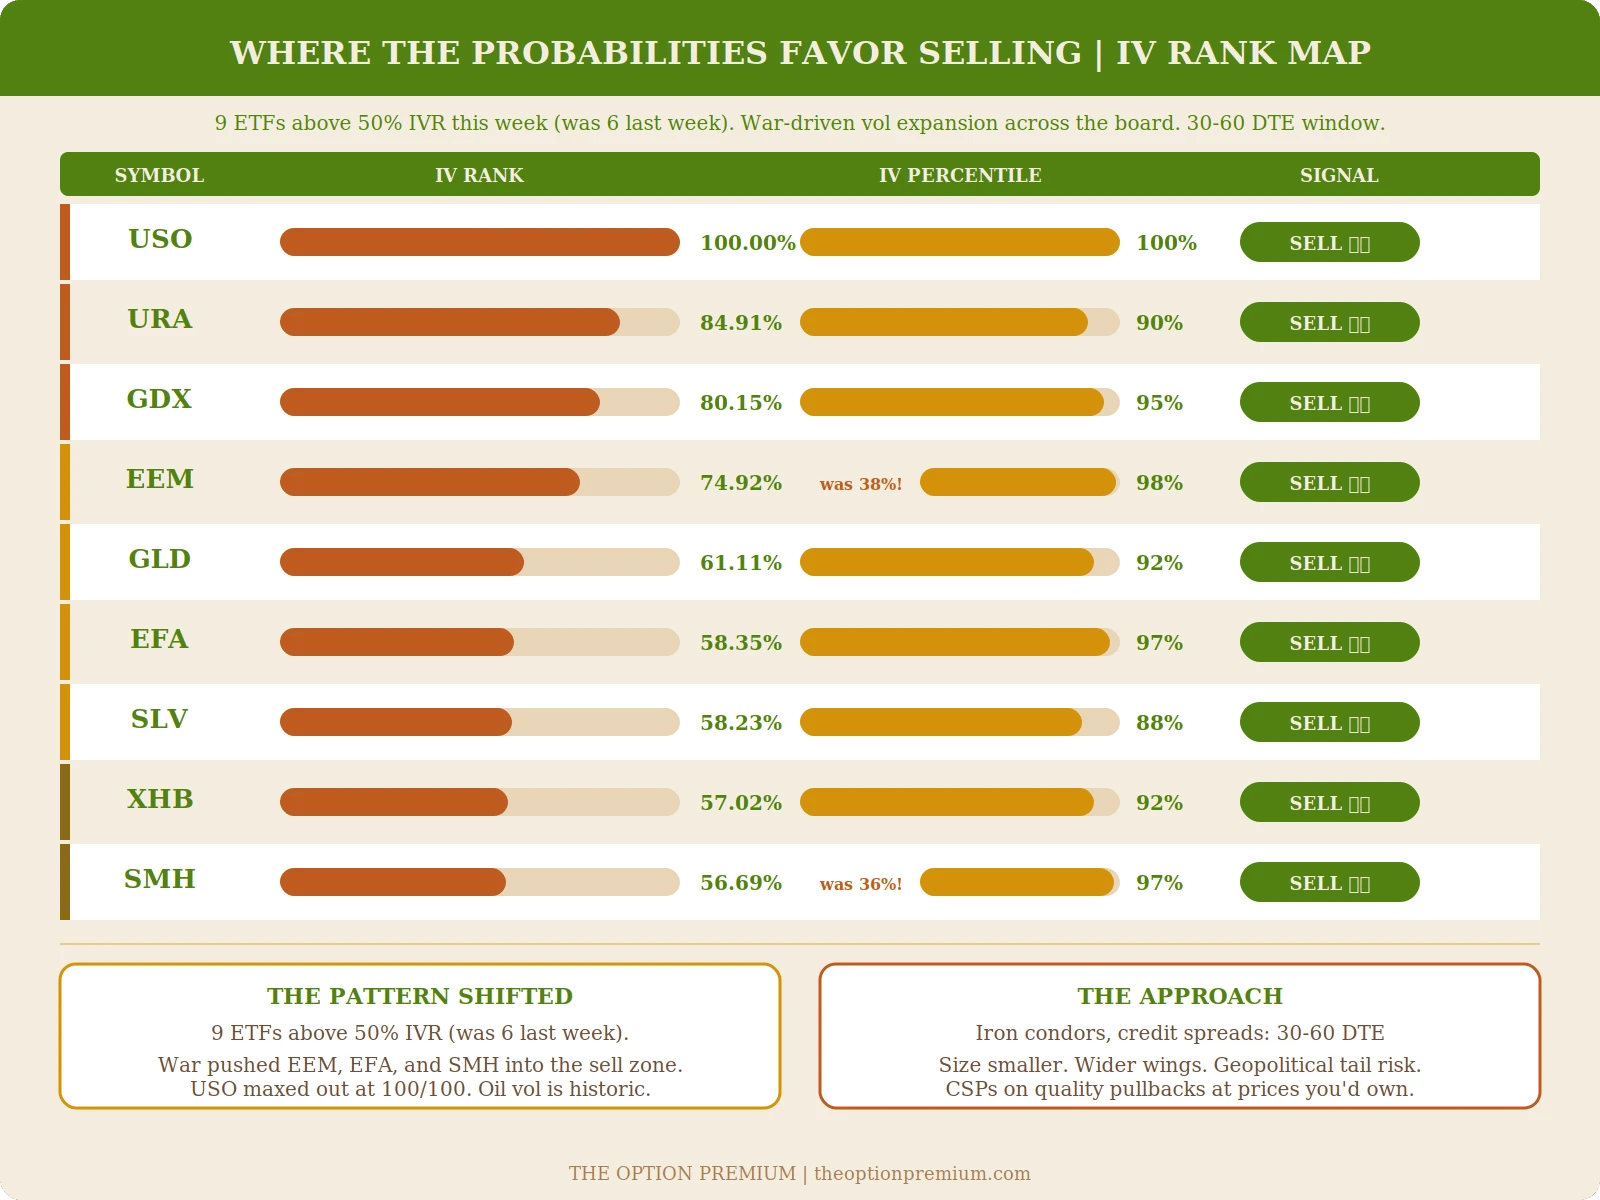
Oil told the story. WTI crude surged above $90 per barrel, posting a 35% weekly gain, the largest since oil futures began trading in 1983. The Strait of Hormuz is effectively shut down. Iran attacked a tanker in the Persian Gulf. Qatar's energy minister warned prices could sprint past $100 if Gulf energy producers halt exports. President Trump said there won't be a deal without "unconditional surrender" and hasn't ruled out ground forces. The timeline: possibly five weeks, possibly longer. For premium sellers, the oil volatility spike is historic. USO's IV Rank hit 100% (both IVR and IVP maxed out). The commodity and emerging market cluster expanded from 6 to 9 ETFs above 50% IVR. This is the richest opportunity set we've seen all year.
Then Friday's jobs report broke the market's back. Nonfarm payrolls came in at negative 92,000, a stunning miss against expectations of positive 56,000 and last month's 126,000. The unemployment rate ticked up to 4.4%. Retail sales fell 0.2% month over month. Over 70% of S&P 500 components declined on the data. The Dow dropped 453 points. The S&P 500 fell 1.33% to 6,740.02, its lowest close since mid-December and 3.42% off its all-time high. The Nasdaq lost 1.59%. The Russell 2000 cratered 2.3%, barely holding above 2,500.
The math just shifted. A week ago, the market was debating whether the Fed would cut rates this year. Now the labor market is contracting, oil is spiking toward triple digits, and the inflation picture is getting more complicated, not less. The February PPI came in hot two weeks ago (core +0.8%). Now oil is adding cost-push pressure across every supply chain. CPI on Wednesday is the next test. If it runs hot while employment deteriorates, that's stagflation. The Fed stays frozen. For our framework, this is where probability-based strategies earn their keep.
The ISM Manufacturing PMI on Monday came in at 52.4, down just barely from January's 52.6 but still expansionary. The manufacturing recovery narrative is intact, but the prices-paid component surged, with more companies reporting higher input costs. That's the oil effect beginning to flow through.
The rotation underneath accelerated. On Friday, 434 of the S&P 500's 500 components were in the red. The ones in the green? Almost exclusively energy, fertilizer, chemicals, and defense. CF Industries surged 5% to a record close and is up 17% week to date. Bunge Global gained 3%. Palantir rallied on its defense/AI role. The S&P 500 equal-weight index is up 3.16% year to date while the cap-weighted index is down 1.54%. That divergence says everything about where the money is flowing.
AAII bullish sentiment dropped to 33.1%, essentially unchanged from last week's 33.2%. Neutral sentiment hit a one-year high at 31.4%. The sentiment washout is holding, but it hasn't triggered the mean-reversion rally that contrarians expected. Now there's a catalyst for it to get worse before it gets better. When fear reaches extremes, patient sellers get their best entries.
Marvell Technology was a bright spot, surging 22% after a strong fourth quarter driven by AI hardware demand. The AI buildout isn't dead; it's narrowing to the companies with real revenue. That's where the PMCC opportunities will live for the next 18 months.
Weekly scorecard: S&P 500 down 2.0% for the week, its worst in nearly five months. Nasdaq down roughly 2.5%. Russell 2000 down about 3.5%. Oil up 35%. Gold held near $5,150. The VIX spiked above 25 from last week's 19.86. The 10-year Treasury yield compressed further as investors fled to safety. Bitcoin near $72,500, down over 45% from its all-time high.
📅 The Week Ahead
Date | Event | Time (ET) |
|---|---|---|
Wed, Mar 11 | February CPI | 8:30 a.m. |
Thu, Mar 12 | February PPI; Weekly Jobless Claims | 8:30 a.m. |
Mon, Mar 16 | NVIDIA GTC Keynote (Jensen Huang) | TBD |
Mar 16-19 | NVIDIA GTC Conference | All Week |
CPI Wednesday is the week's defining event. After two weeks of hot PPI data and oil surging 35%, the market needs to know whether inflation is reaccelerating. A hot CPI print with last Friday's negative payrolls number would put "stagflation" squarely on the table. A cooler reading would give the Fed room to consider cuts and could trigger a relief rally.
Either way, implied volatility will most likely be elevated heading into the number, which means richer credits for anyone selling premium in the 30-60 DTE window. PPI Thursday provides the second data point. NVIDIA's GTC conference begins the following Monday with Jensen Huang's keynote, which could reset the AI narrative after a brutal February for tech. Morgan Stanley expects details on a new four-year roadmap. Watch semiconductor IV closely.
📊 Weekly Market Stats
Index / Indicator | Close | Week | YTD |
|---|---|---|---|
S&P 500 | 6,740.02 | -2.0% | -1.5% |
Dow Jones | 47,501.55 | -3.0% | -2.5% |
NASDAQ Composite | 22,387.68 | -2.5% | -4.8% |
Russell 2000 | ~2,520 | -3.5% | +2.5% |
10-Year Treasury | ~3.85% | -13 bps | -34 bps |
WTI Crude Oil | ~$90.50 | +35% | +55% |
Gold | ~$5,150 | -1.5% | +9.3% |
VIX | ~25.26 | +27% | +62% |
Fed Funds Rate | 3.50-3.75% | Unchanged | Unchanged |
📰 Weekly In-Depth Articles
🗓️ Tuesday, March 3rd: Position Sizing: Van Tharp's Golden Rule
🗓️ Thursday, March 5th: Why Selling Options Is Different from Buying: The Premium Seller's Edge
🧑💻 The Research Desk
Forty-one analysts cover NVDA with a $271.89 average target. The options market prices the 12-month probability of touch at 35%. See the real numbers before chasing the next bold call.
Learn LEAPS options the right way, mechanics, delta & extrinsic value, deep ITM selection, PMCC steps, rolling, risk, taxes/IRAs, examples, tools, FAQs.
🎓 Options 101: Delta Explained: The Most Important Number in Options Trading
If you could only look at one number before placing an options trade, it should be delta. Not premium, not the expiration date, not even the stock price. Delta tells you how much your option will move per $1 stock change and approximately how likely it is to expire in the money. No other Greek does double duty like that.
This week, I published a deep dive on delta covering everything from the basics to exactly how I use it in my own trading. You'll learn why delta is a probability proxy (a 0.20 delta put has roughly an 80% chance of expiring worthless), the three variables that change delta after you enter a trade, how to select strikes by delta instead of price, and the four ways delta should inform your process from entry to portfolio management. If you only read one article on the Greeks, this is the one.
👉 Read the full breakdown: Delta Explained: The Most Important Number in Options Trading
🧠 Mental Capital: Put Options Explained: Downside Protection and Income Generation
Put options are the most misunderstood contract in options trading. Most beginners see them as a bearish bet. That's only half the story. On the selling side, puts become one of the most powerful income-generating tools available to retail traders. Understanding both sides isn't optional.
This week, I published a complete guide covering both sides of the put option. You'll learn when buying puts makes sense (portfolio protection, locking in gains, bearish conviction, event hedging), when selling puts makes sense (income on stocks you'd own, elevated IV, Wheel Strategy entry), step-by-step examples for both the protective put and the cash-secured put, my standard put-selling framework (0.15-0.25 delta, 30-45 DTE, the ownership test, management rules), and the five most common put option mistakes that cost traders money.
👉 Read the full article: Put Options Explained: Downside Protection and Income Generation
Educational Corner: Credit Spread Width: $2, $5, or $10 Wide?
You've picked your short strike by delta. You know the expiration. The IV checks out. Now: how wide should the spread be? The width between your short and long strikes determines your max loss, return on capital, and capital efficiency on every trade. A $2.50, $5, and $10 wide spread on the same short strike produce three completely different risk profiles, even though the probability of profit is nearly identical.
This week, I published a complete guide comparing all three widths side by side on the same $190 short strike. You'll see the exact numbers across all key metrics, how the same $1,000 risk budget creates three completely different structures (with the narrower spread generating $510 vs $220 in potential profit), a dual-line chart showing the diminishing returns of wider spreads, an account sizing framework matching width to account size from under $25K to above $200K, and how IV environment links to width selection.
👉 Read the full breakdown: Credit Spread Width: $2, $5, or $10 Wide?
📊 The Implied Truth
The Weekly ETF Volatility and Trend Intelligence Report
Want the full 100+ equity breakdown and trade frameworks? Upgrade at The Implied Perspective.

ETF Weekly Watchlist
Where the Probabilities Favor Selling (IV Rank > 50%)
The sell zone expanded from 6 ETFs to 9 this week. War-driven volatility pushed EEM (74.92%, up from 38%), SMH (56.69%, up from 36%), and EFA (58.35%) into the rich-premium tier. USO maxed out at 100% IVR and 100% IVP, the first time we've seen a perfect score on both metrics. URA (84.91%), GDX (80.15%), GLD (61.11%), SLV (58.23%), and XHB (57.02%) round out the table, all with IV Percentile above 88% confirming this isn't a one-day spike.
The opportunity set is the richest it's been all year. The 30-60 DTE window maximizes theta decay while the volatility risk premium works in our favor 80-85% of the time. Iron condors, credit spreads, and cash-secured puts are all in play. The critical difference from normal weeks: size smaller and use wider wings. Geopolitical tail risk is real. A Strait of Hormuz closure lasting weeks could push oil to $120+. Account for that in your position sizing.
Respect the Trend
Energy is the only sector with +DI dominant and rising relative strength. XLE sits at ADX 47.62 (institutional conviction), RS 68.82, with +DI at 33.43 firmly above -DI at 12.92. USO is even more extreme: ADX 38.34, RS 89.34, +DI at 63.72 crushing -DI at 7.49. XOP follows the same pattern at ADX 37.43 with RS 75.02. These are the strongest directional readings in the entire watchlist. PMCCs with conservative deltas (10 delta or lower) let you participate without getting run over by war-driven gaps.
XLP flipped bearish this week. Last week it had the strongest ADX in the table with a bullish trend. Now -DI (27.1) dominates +DI (20.15). Staples are no longer a safe trend play. XLU remains bullish (+DI 24.55 vs -DI 20.77, RS 61.21) but IVR is only 19.6%, so the math says don't sell premium. LEAPS and debit spreads only.
TLT continues to attract flight-to-safety flows as the 10-year compresses below 3.85%, but ADX is still low at 15.77. The bond trend is young. No rush.

The Vol Shift
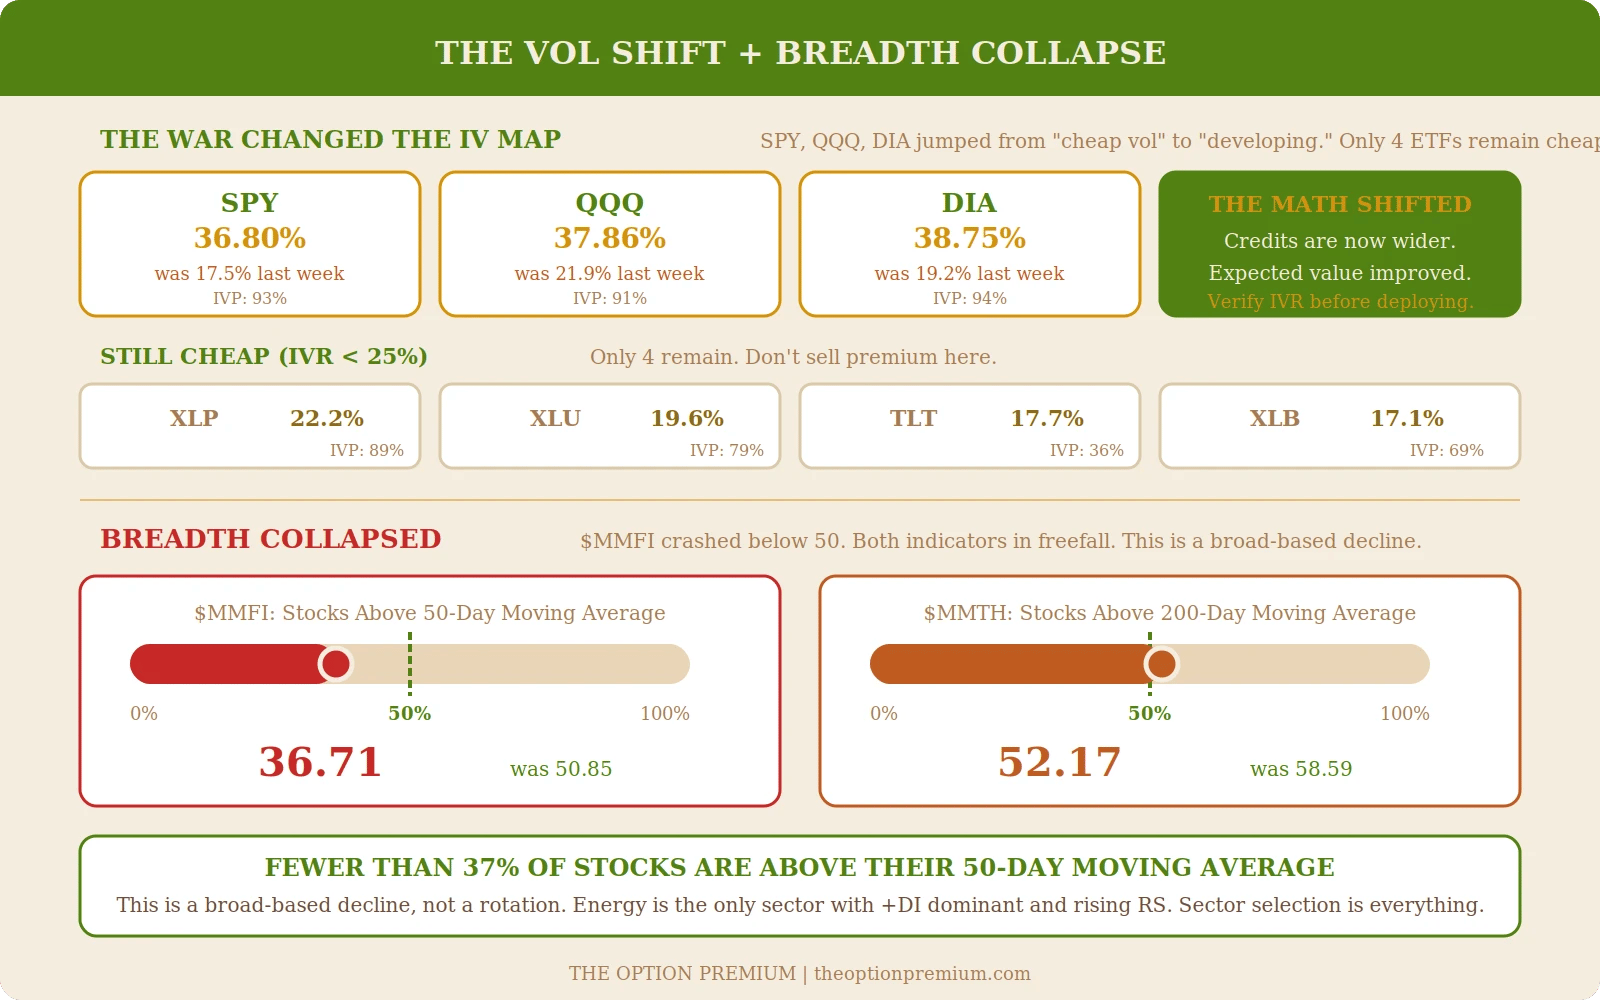
This is the biggest single-week change we've seen in the IV map. SPY jumped from 17.5% to 36.8% IVR. QQQ from 21.9% to 37.9%. DIA from 19.2% to 38.8%. Last week these were in the "don't sell" zone. Now they're approaching the threshold where credits have positive expected value. The VIX surged from 19.86 to 29.86, a 50% jump.
Only four ETFs remain in cheap-vol territory: XLP (22.2%), XLU (19.6%), TLT (17.7%), and XLB (17.1%). That's down from seven last week. The war repriced volatility across nearly every asset class.
For the indexes now in the 35-40% IVR range, the math is improving but not yet compelling. If IVR pushes above 40-45% with IV Percentile above 90% (which it already is for SPY, QQQ, and DIA), credit spreads start to make sense. Watch for follow-through next week.
Breadth Collapsed
$MMFI crashed to 36.71 from 50.85 last week. Fewer than 37% of stocks are above their 50-day moving average. $MMTH dropped to 52.17 from 58.59. Both show "Below 50" RSI momentum with -DI firmly dominant (ADX 28-30, -DI above 48 on both).
This is no longer a narrowing rally. This is a broad-based decline. The only sector with positive relative strength and bullish directional indicators is energy. When breadth collapses while the VIX spikes above 29, the market is telling you that fear is spreading beyond just the headline names. Sector selection is everything right now.
Notable Moves
IBIT (Bitcoin ETF): IVR jumped to 44.34% (from 35.96%). ADX 32.16 with -DI and +DI nearly equal (29.92 vs 25.46). The trend is weakening but the volatility expansion is real. Bitcoin near $72,500 remains down over 45% from highs.
EEM (Emerging Markets): IVR surged to 74.92% (from 38.14%). IV Percentile 98%. This is now firmly in the sell zone. ADX 29.52 with -DI dominant (36.30 vs 26.85). Credit spreads with bearish bias make sense here.
SMH (Semiconductors): IVR jumped to 56.69% (from 36.08%). IV Percentile 97%. The NVIDIA post-earnings vol combined with war uncertainty pushed semis into rich territory. GTC conference next week could be a catalyst in either direction.
This Week's Framework
Where IV is rich (9 ETFs above 50% IVR): The math strongly favors selling. Iron condors, credit spreads, CSPs. 30-60 DTE. USO, URA, GDX lead with the richest premiums. Size smaller than normal. Wider wings for geopolitical tail risk.
Where trends are strong (energy): XLE, XOP, USO all show institutional ADX with +DI dominant. PMCCs with conservative deltas. Don't fight the trend, ride it with defined risk.
Where IV is developing (indexes at 35-40% IVR): Monitor closely. If IVR pushes above 40-45%, the expected value math tips in favor of selling. SPY, QQQ, DIA are right on the edge.
Where IV is still cheap (XLP, XLU, TLT, XLB): Don't sell premium. Debit spreads for directional views, deep ITM LEAPS for new PMCCs.
Quality names pulling back (tech, software, semis): Cash-secured puts at strikes where the probability of assignment aligns with prices you'd happily own. SMH's elevated IVR makes semiconductor CSPs particularly attractive ahead of GTC.
Field | What It Tells You |
|---|---|
IV Rank (IVR) | Where today's IV sits vs. 52-week range (0-100%). >35% favors premium selling |
IV Percentile (IVP) | % of trading days with lower IV. Confirms persistent elevation |
Relative Strength (RS) | Momentum vs. broader market. Above 65 = leader |
ADX | Trend strength. >25 established, >35 strong, >40 institutional conviction |
👉 For specific trade frameworks, delta setups, and the full 100+ equity breakdown, read this week's Implied Perspective at theoptionpremium.com
The Bottom Line
The market went from complacent to chaotic in five days. Oil surged 35%, the biggest weekly gain in the history of crude futures. Payrolls went negative for the first time in years. The VIX jumped 27%. The S&P 500 posted its worst week in five months and closed at its lowest level since December.
And for probability-based traders, this is where the edge sharpens.
When volatility spikes, credits get richer. When fear rises, the gap between implied and realized volatility widens. When breadth deteriorates, sector selection separates the disciplined from the hopeful. Every tool in our framework, the IV Rank maps, the trend filters, the position sizing rules, exists for weeks exactly like this one.
CPI Wednesday is the next catalyst. If it confirms what oil is signaling, the stagflation conversation gets louder. If it cools, the relief rally could be swift. Either way, the premiums are there. Size accordingly.
The war will run its course. The data will keep coming. Your job is to follow the math, manage risk, and make sure your capital is still here when the dust settles.
🔗 Let’s Stay Connected
Have questions, feedback, or just want to say hello? I’d love to hear from you.
📩 Email me anytime at [email protected]
📺 Subscribe on YouTube so you’ll be notified when the first videos are released.
👥 Join the private Facebook group or connect with me on X.
Send me your topic requests, whether for the newsletter, YouTube, or webinars. Seriously, send them. 🙂
Thanks again for reading. I hope you found today’s insights valuable and worth your time.
Trade Smart. Trade Thoughtfully.
Andy Crowder
Founder | Editor-in-Chief | Chief Options Strategist
The Option Premium
The Option Premium is published for educational purposes only and does not constitute personalized investment advice. Options involve risk and are not suitable for all investors. Past performance does not guarantee future results. Always confirm details and manage risk prudently.
Reply