- The Option Premium
- Posts
- 📩 The Option Premium Weekly Issue - July 20, 2025
📩 The Option Premium Weekly Issue - July 20, 2025
23.3% Annualized. 11.69% PMCC Returns. And the Data-Driven Framework Behind It All.
Every week, I write this for the trader who’s tired of the noise, the one looking for clear mechanics, defined risk, and a path to consistent returns. No hype. No fluff. Just strategies I’ve refined over 23+ years of managing real capital in real markets.
I’m not a marketer. I’m a trader. I don’t run ads. I don’t sell dreams. This publication runs entirely on one thing: reader support.
So if you've found value here, consider supporting the work in one of two ways:
👉 Subscribe to one of the services below (starting at just $9/month), or
👉 Share this newsletter with a fellow trader who wants to get better
And if you're wondering whether it's worth it, consider this:
💸 A $27 Decision That Returned $541
Since launching The Income Foundation just under three months ago, the model portfolio has closed 7 straight profitable trades, with an average return of +1.60% per trade and an annualized return of 23.3%.
That’s $541 in documented gains, from a strategy designed for simplicity and capital preservation.
And the cost? Just $9/month. That means someone who subscribed on Day 1 has paid $27 total, and made over 20x that in trade income.
This isn't about chasing home runs or making oversized gambles. It's about building consistent, repeatable, risk-managed income streams through systematic approaches. This is precisely the framework we implement and teach here, delivering exceptional value through disciplined weekly instruction at a fraction of what others charge for inferior options education. I’m confident, and proud, stating this is the best service of its kind.
🧾 Recent Results: Consistent Profits, No Wild Claims
Let’s talk facts, not fantasy.
Our Income Foundation portfolio, built on high-probability cash-secured puts and covered calls (Wheel Strategy), has now closed 7 straight winning trades since May 7, with:
✅ 23.3% Annualized Return based on actual trade durations and frequency
🧮 Average return per trade: 1.60%
⏱️ Average holding period: 27.9 days
There’s a more aggressive metric too, a 71.4% annualized return using total gains over the full 72-day window. But that assumes full capital deployment 100% of the time. We prefer to stick with the 23.3% number. It's repeatable, grounded, and backed by a strategy designed to work across market regimes.
And that’s just one service.
Over in Wealth Without Shares, we’re scaling this approach with multiple Poor Man’s Covered Call portfolios, each tuned for different objectives, from small-cap growth to large-cap dividend strength. Across nine active PMCC trades, the average stock return is 3.63% , while our average PMCC return is +11.69%, reflecting the power of structured leverage and consistent short-call income.
🙌 Can’t Join Yet?
I get it. If you're not ready to subscribe, here’s how you can still support The Option Premium:
Forward this issue to a trader in your circle who’s tired of hype and ready for structure.
Share a quote, article, or trade idea from this newsletter on X and tag @TheOptPremium so others can follow along.
Bookmark www.theoptionpremium.com and explore deep-dive articles, model portfolios, and practical options education you won’t find on social media.
Mention us in a Discord, Reddit, or Facebook group where traders value real strategy over empty signals.
This publication grows solely through word-of-mouth. No ads. No affiliate junk. Just traders supporting traders.
👉 If you’re ready to go deeper and want real-time trade alerts, full model portfolios, ongoing education and extended breakdowns of setups like these, please consider joining one of our services:
📉 Market Snapshot and Commentary
Climbing Walls of Worry, One Catalyst at a Time
Markets pushed to new all-time highs again last week, with the S&P 500 rising another 0.6% and now up over 26% from the April 8 lows. Positive economic data helped propel the rally, even as tariff-related uncertainty continues to loom.
What’s driving the strength?
Inflation remains contained.
June’s CPI and PPI reports came in largely as expected. Headline CPI ticked up to 2.7%, while PPI eased to 2.3%, below estimates. While tariffs are rising, they haven’t yet triggered runaway price increases.The U.S. consumer is holding firm.
June retail sales grew 0.6% vs. just 0.1% expected. Consumers are still spending, especially on autos, apparel, and food services, suggesting household demand remains a pillar of the economy.Corporate earnings are exceeding expectations.
With 12% of S&P 500 companies reporting so far, 86% have topped estimates, far above the 10-year average of 75%. Financials, in particular, are delivering strong upside surprises.
What about tariffs?
Yes, they remain the biggest question mark. Average U.S. tariff rates have surged to 20.6%, the highest since 1910. But inflation hasn't yet spiked, likely because costs are being absorbed across supply chains, inventories are buffered, and oil prices have stayed subdued.
As we approach the August 1 tariff deadline, markets may face renewed volatility. However, ongoing negotiations (China, Vietnam, Indonesia) and easing export restrictions (e.g., NVIDIA chips) hint that progress is being made behind the scenes.
Looking ahead
We may see short-term pullbacks, particularly as we enter the seasonally choppy August–September stretch. But the bigger picture is still constructive: potential rate cuts, new tax policy support, and earnings resilience could power a reacceleration into 2026.
Investors might use any weakness as a chance to rebalance into U.S. large- and mid-cap equities, especially across a mix of growth (tech, discretionary) and value (financials, health care) sectors.
🧮 Weekly Market Stats
Index | Close | Weekly | YTD |
|---|---|---|---|
🏛️ Dow Jones Industrial Avg. | 44,342 | -0.1% | 4.2% |
📈 S&P 500 Index | 6,297 | +0.6% | 7.1% |
💻 NASDAQ | 20,896 | +1.5% | 8.2% |
🌍 MSCI EAFE* | 2,629 | -0.7% | 16.3% |
💵 10-Yr Treasury Yield | 4.43% | 0.0% | +0.5% |
🛢️ Oil (WTI) / barrel | $66.06 | -3.5% | -7.9% |
🧾 Bonds (Aggregate Index) | $98.11 | +0.1% | +3.0% |
📰 Weekly In-Depth Articles
🗓️ Tuesday, July 15th - What Academic Researchers Discovered About Options Trading Will Change How You Trade
🗓️ Thursday, July 17th - The Poor Man's Covered Put: A Smarter Way to Profit from Falling Markets
🎓 Options 101: The First Steps to Trading
Understanding Bid-Ask Spreads: How Poor Execution Costs Real Money
Meet Sarah, a thoughtful new options trader who knew her strategies cold, but missed one critical piece: execution.
She used market orders to sell covered calls, not realizing she was consistently accepting the worst possible price. Just $20 lost here, $30 there…until the habit cost her over $1,200 in a year.
This week’s Options 101 article shows how one small shift, working limit orders at the midpoint, turned Sarah’s results around. You’ll learn:
The difference between market and limit orders
How to “work the mid” like a pro
A simple 10-minute system that could add tens of thousands to your lifetime results
📍 Read the full story and start placing smarter trades:
👉 Understanding Bid-Ask Spreads in Options Trading: How Poor Execution Costs Real Money
🧠 Mental Capital
Train not just your trading system, but your trading self.
The Sunk Cost Fallacy in Options
Too many traders hold onto bad trades for one simple reason: they’ve already invested too much to walk away.
But in options trading, sunk costs become account killers. Every day you delay exiting a losing trade because of “what you’ve already spent,” theta decay and diminishing probabilities eat away at what’s left.
In this week’s Mental Capital, we break down:
✔️ Why your brain is wired to hold losers too long
✔️ How options-specific factors like leverage and time decay amplify sunk cost errors
✔️ The “Fresh Capital Protocol” professionals use to reset emotionally and mathematically
✔️ Why “rolling to next month” often compounds mistakes, not fixes them
✔️ How to build a systematic exit process that protects your capital and your confidence
Because surviving as a trader isn’t just about finding good trades, it’s about cutting the bad ones without flinching.
📊 The Implied Truth: Weekly Table Overview
Unlock the Full Picture – Upgrade to access the complete table, including all 100 equities (AAPL, META, AMZN, NVDA and more)
Every number tells a story. Each week, we decode the landscape across the most liquid ETFs, because this is where retail traders get the cleanest signals and the least slippage.
But the power isn’t in the data, it’s in how you interpret it.
Below is your edge: a strategic overview that reveals where the premium is overpriced, where price action is exhausted, and where the highest-probability setups exist for the coming week.
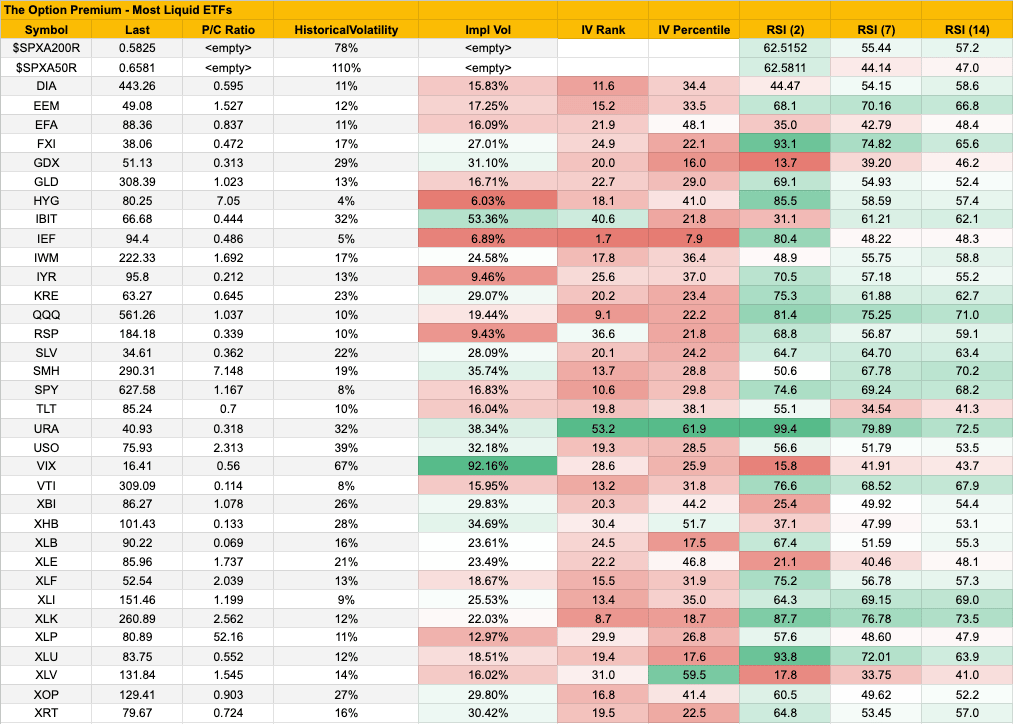
Week Ending July 18, 2025
Volatility across the major indices remains muted $VIX sits at 16.41 with IV Rank under 30%. But look closer: dispersion is rising, and several sector ETFs are flashing actionable setups. This table doesn’t lie, it’s a distilled view of where opportunity and risk live.
This section is here to help you choose what works for your strategy. The numbers are facts, not opinions. Whether you sell premium, buy directional spreads, or trade reversals, the edge begins with understanding volatility and momentum. Let’s dig in.
1. High-Volatility, Tradable RSI Setups
Where IV Rank is elevated and RSI isn’t screaming overbought:
URA – IV Rank: 53% | RSI (7): 79 → uranium is hot and expensive, but risk can be defined.
SMH, XBI, XHB, XRT, USO, GDX – All offer clean combinations of rising implied vol and neutral momentum, ideal for high-probability, risk-defined trades.
Look here first if you're selling premium or building iron condors.
2. Overbought But Cheap (Low Vol, High RSI)
These names are extended, but volatility is too low to pay you for the risk:
QQQ, XLK, SPY, VTI - RSI (2) above 74, IV Rank under 14%.
Momentum says fade. Volatility says don’t bother. Stick to long options or carefully timed calendars if you're trading these.
3. Index Quiet, Sector Noise
While SPY and QQQ are dull, sector ETFs like RSP, XBI, and URA show real movement beneath the surface.
RSP (Equal-weight S&P 500) has 36.6% IV Rank, significantly higher than SPY.
Conclusion: Dispersion is here. Volatility is hiding in plain sight, but not where the headlines are.
4. Unusual Volatility-Momentum Combinations
HYG – RSI 85 with only 6% IV Rank. Complacency in junk bonds.
IBIT – High IV, mid-range RSI. Crypto sentiment remains shaky.
TLT – Lower RSI, low IV. Quiet on the surface, but bonds are coiling.
When RSI and IV don’t agree, it often pays to look twice.
5. Final Signals from The Implied Truth
✅ Top Premium Setups: IBIT, URA, XBI, GDX
📉 Best Reversal Fades: URA, XLK, QQQ
🧯 Risk Alert: Oversold VIX + heavy SMH hedging
🪫 Avoid: SPY, QQQ, XLK, VTI
What This Table Tells Us
Use this weekly to guide your trade ideas, not predict outcomes.
The data is factual. There’s no opinion in this grid, only opportunity.
Choose what aligns with your timeframe, risk appetite, and edge.
Quick Reference: The Implied Truth Table
Field | Meaning |
|---|---|
P/C Ratio | Put/Call ratio: >1 = bearish skew, <1 = bullish bias, extremes may signal contrarian trades |
Impl Vol | Implied Volatility: higher IV = richer premiums, more expected movement |
IV Rank | IV vs. past year’s range (0–100%), >35% often favors premium-selling |
IV Percentile | % of time IV has been below current level, helps confirm if volatility is elevated |
RSI (2/7/14) | Momentum reading: >80 = overbought, <20 = oversold, shorter RSIs react faster |
📚 Educational Corner: Options Deep Dive
What Makes a Trade "High Probability"? Why So Many Options Traders Get It Wrong
Most options traders misinterpret what "high probability" really means, falling into the trap of trusting delta or POP as guarantees. This article dismantles that illusion by showing why strategy alone isn’t enough. Instead, true high-probability trading depends on three pillars: defined risk structure, premium-to-risk optimization, and Greek alignment.
We explain why consistent profits come not from theoretical probabilities but from proper position sizing, collecting adequate premium, and actively managing trades, often exiting early to avoid late-cycle risk. Using examples like iron condors, we demonstrate how traders can transform textbook win rates into real-world success. The final edge? Psychological discipline and system-level integration that bring consistency to chaotic markets.
If you’re relying on delta alone, you're not trading high probability, you’re just hoping.
👉 Read the full article on The Option Premium to master what really separates successful traders from the rest.
🔗 Let’s Stay Connected
Have questions, feedback, or just want to say hello? I’d love to hear from you.
📩 Email me anytime at [email protected]
Thanks again for reading. I hope you found today’s insights valuable and worth your time.
Trade Smart. Trade Thoughtfully.
Andy Crowder
Founder | Editor-in-Chief | Chief Options Strategist
The Option Premium
Reply