- The Option Premium
- Posts
- 📩 The Option Premium Weekly Issue - July 13, 2025
📩 The Option Premium Weekly Issue - July 13, 2025
Volatility Pockets, Overbought ETFs, and Earnings Around the Corner
Earnings season kicks off this week, but forget the breathless headlines and analyst hand-wringing. The real story is written in the numbers, and they're whispering something most traders aren't hearing.
Sure, the VIX is lounging below 17 like it's on vacation. Market breadth is perking up. The major indexes are drifting higher with all the urgency of a Sunday stroll. Wall Street's mood feels downright drowsy.
But here's what your screen isn't telling you: volatility is being systematically mispriced, and the smart money is already positioning for the correction.
The evidence is hiding in plain sight. IBIT, SLV, SMH, and XLE are stretched tighter than a drum across multiple RSI timeframes, the kind of technical exhaustion that makes seasoned traders start licking their chops. Meanwhile, implied volatility is quietly spiking in the corners of the market where retail doesn't usually look: metals, crypto, energy, and uranium plays.
Consider this your early warning system. Breadth indicators like $SPXA50R and $SPXA200R are finally showing some backbone, which means neutral-to-bullish strategies have room to breathe. But those put/call ratios in the hottest sectors? They're screaming one-sided positioning, exactly the kind of crowded trade that tends to unwind when you least expect it.
Then there's the earnings wildcard. Big bank results start rolling in this week, and with them come all the usual suspects: expected move dislocations, post-earnings IV crush setups, and those sweet short-duration opportunities that pop up when single-name volatility goes haywire.
The bottom line? While everyone else is watching the headlines, The Implied Truth is watching the data. No drama, no predictions, just clean signals built on what the market is actually doing, not what it's supposed to do.
Time to dig into what really matters.
🧾 If you’re curious how I approach earnings season, check out the following reports. This is the most aggressive strategy I use, but it’s still grounded in the same statistical principles that guide all of my trading.
Explore the in-depth, quantitative approach to the best strikes, probabilities, and setups for earnings trades: learn the mechanics of the high-probability approach.
Discover why zero-day options (0DTE) might be overhyped and how structured earnings trades using implied volatility give options traders a clear, repeatable edge. Ideal for beginner and advanced options traders.
📉 Market Snapshot and Commentary
Tariffs, Taxes, and the Illusion of Calm
Stocks hovered near all-time highs this week, despite headlines that would normally rattle markets, namely, a fresh round of tariffs and the passage of a sweeping tax bill. Gains in the energy and industrial sectors helped offset tariff concerns, as investors largely looked past near-term risks. But don’t mistake quiet price action for real conviction. Markets are balancing on a narrow ledge, supported by a late-cycle fiscal boost and restrained monetary policy.
The newly signed One Big Beautiful Bill Act extended provisions of the 2017 tax cuts and added deductions for tips, overtime, and SALT, up to $40,000. While this should provide short-term relief to businesses and high earners, it comes with a projected $3.3 trillion increase in federal deficits over the next decade. Certain provisions, like 100% bonus depreciation, may help reaccelerate growth in 2026–2027, but the immediate economic lift looks modest. Investors should keep an eye on how these policies ripple through capital spending and corporate margins.
Meanwhile, new tariffs of 15–50% were announced on more than 20 countries, reviving trade tensions just as inflation seemed to be cooling. The hit to profit margins may be harder to absorb this time, especially in sectors with thin pricing power. While inflation could drift higher in the near term, we don’t see this as a persistent threat. The Fed appears content to wait, but if growth slows further, expect rate cuts to resume in the fall, possibly pushing the fed funds rate closer to 3% by 2026.
With stocks priced for perfection, pullbacks should be expected, not feared. Traders should look to volatility not as a signal to panic, but as a window to deploy high-probability strategies, especially where sector trends and option premiums still offer a real edge. In markets like these, structure matters more than ever.
Weekly Market Performance
INDEX | CLOSE | WEEK | YTD |
|---|---|---|---|
Dow Jones Industrial Average | 44,372 | -1.0% | 4.3% |
S&P 500 Index | 6,260 | -0.3% | 6.4% |
NASDAQ | 20,586 | -0.1% | 6.6% |
MSCI EAFE * | 2,666 | 0.3% | 17.9% |
10-yr Treasury Yield | 4.42% | 0.1% | 0.5% |
Oil ($/bbl) | $68.69 | 2.5% | -4.2% |
Bonds | $98.05 | -0.4% | 3.6% |
📰 Weekly In-Depth Articles
🗓️ Tuesday, July 8th - The Options Industry's $2 Billion Problem
🗓️ Thursday, July 10th - When Professors Crack the Code: How Taiwan Researchers Just Solved Option Selling's Biggest Problem
🎓 Options 101: The First Steps to Trading
Open Interest & Volume, What Smart Traders Check Before Every Trade
Most beginners focus on price. But smart options traders? They check two other numbers first: Open Interest and Volume.
In this week’s Option Premium guide, we explain exactly what these two terms mean — and how they help you avoid trading illiquid, risky contracts that can eat into your profits.
✅ What volume and open interest actually tell you
✅ How to spot real trading activity vs. noise
✅ Why high volume without rising open interest can be a trap
✅ How pros use these signals to time trades and manage risk
✅ Real-world AAPL examples you can apply today
If you’ve ever wondered which strike to pick or why a trade feels hard to exit, this article gives you the clarity you need to stop guessing and start trading with confidence.
👉 Read the full breakdown: Open Interest and Volume: The Liquidity Signals That Separate Smart Money from Dumb Money
🧠 Mental Capital
Train not just your trading system, but your trading self.
FOMO in Options Trading, Why the Trades That Feel Urgent Are Usually the Worst
What if your biggest trading mistake wasn’t missing a move, but chasing one?
This week in The Option Premium, we unpack the most costly emotional trigger in options trading: FOMO. Drawing on neuroscience, real-world examples, and behavioral finance, we reveal why the trades that feel urgent are often the ones that hurt the most.
Inside:
✅ The neurochemical reality of FOMO, and how it hijacks your decisions
✅ Why options traders are uniquely vulnerable to “chasing” behavior
✅ The 6-stage anatomy of a FOMO trade (and how to spot it early)
✅ How pros defend against social media-fueled impulse trades
✅ A complete framework to rewire how you handle missed opportunities
This isn’t about discipline for discipline’s sake. It’s about protecting your capital, your confidence, and your cognitive edge.
👉 Read the full breakdown at Mental Capital: FOMO in Options Trading
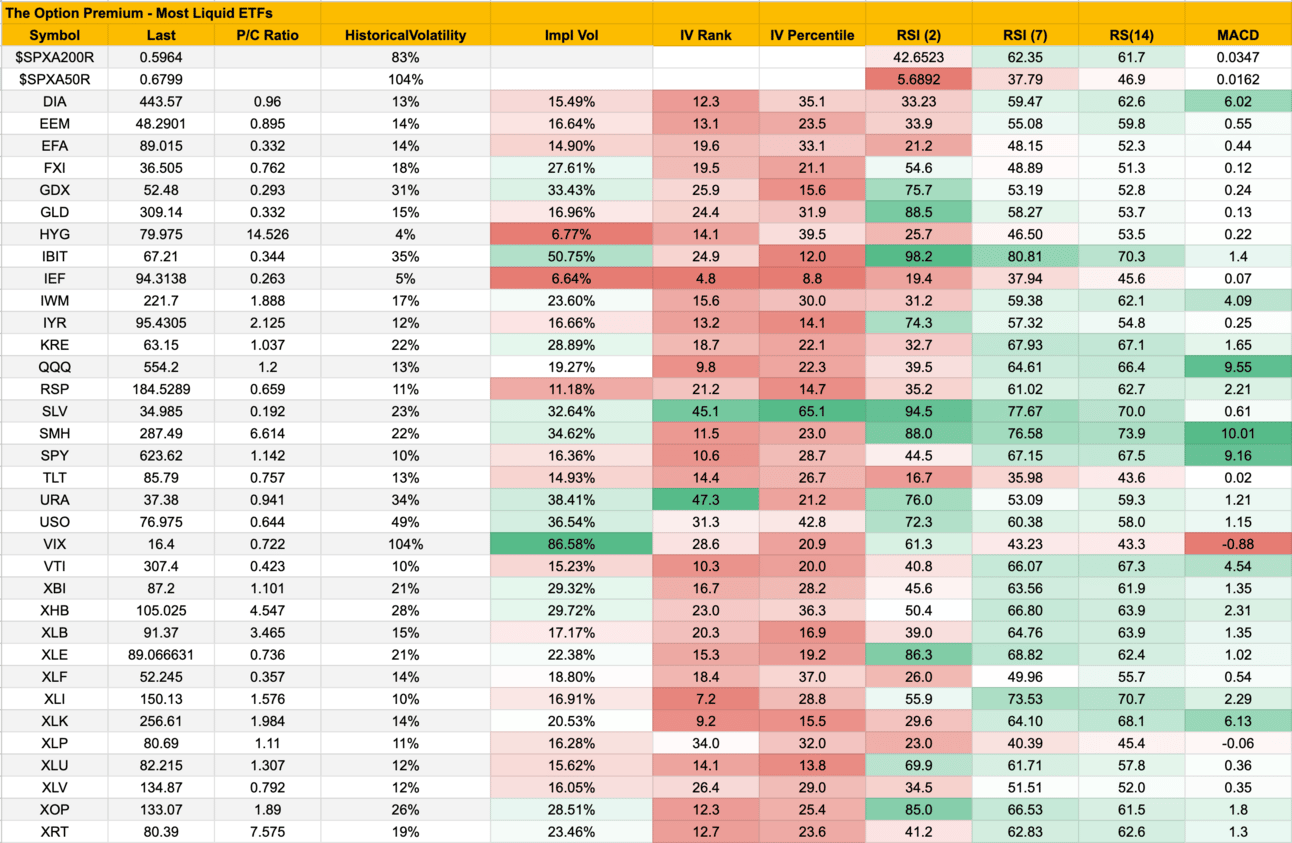
📊 The Implied Truth: Weekly Table Overview
Unlock the Full Picture – Upgrade to access the complete table, including all 100 equities (AAPL, META, AMZN, NVDA and more)
At the close of trading July 11, 2025
Every number tells a story. Each week, we decode the landscape across the most liquid ETFs, because this is where retail traders get the cleanest signals and the least slippage.
But the power isn’t in the data, it’s in how you interpret it.
Below is your edge: a strategic overview that reveals where the premium is overpriced, where price action is exhausted, and where the highest-probability setups exist for the coming week.
The Market Is Up, But Participation Is Still Suspect
We track the $SPXA200R and $SPXA50R to get an internal read on the S&P 500, these show what % of stocks are above their 200-day and 50-day moving averages.
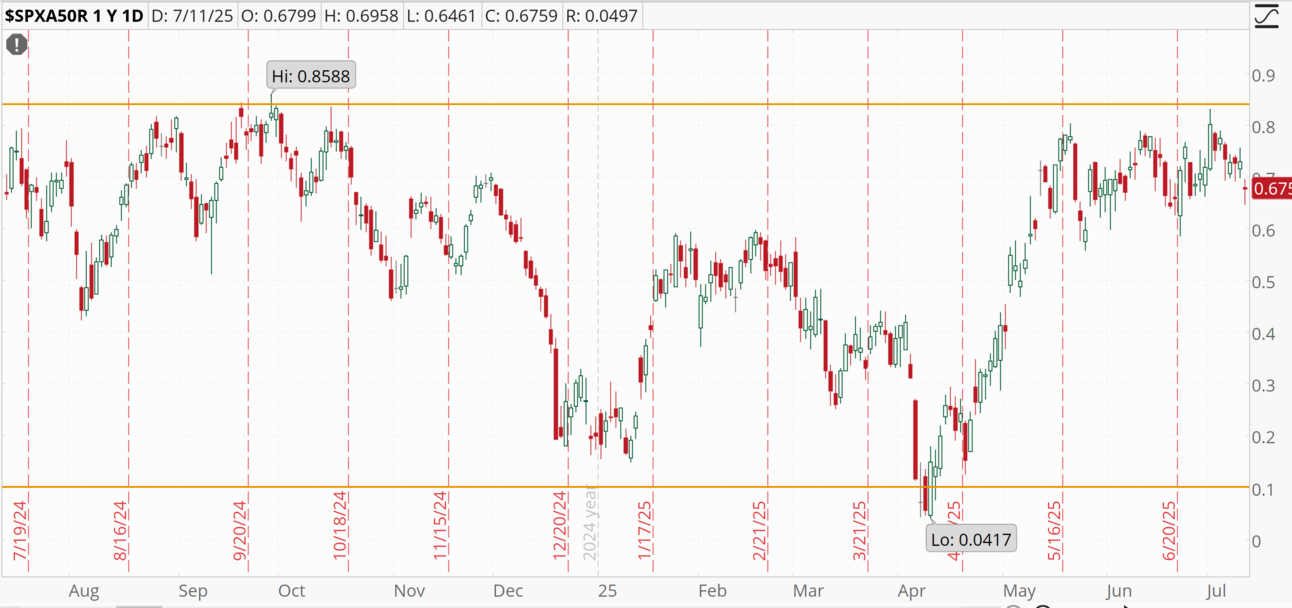
S&P 500 50-day MA
$SPXA200R: 59.6% – Almost 60% of S&P names are in long-term uptrends. Healthy, but not euphoric.
$SPXA50R: 67.9% – Near-term breadth is stronger, meaning short-term participation is picking up? Or, after pushing above 0.80, is the resulting pullback over the past seven trading sessions a sign of things to come?
📈 Takeaway: As it stands, this supports neutral-to-bullish premium-selling strategies like iron condors on SPY, QQQ, or RSP. Broad participation suggests support under the market, not fragility.
The Silent Signal: VIX Is Lying to You
VIX = 16.4
Historical Vol: 104%, yet Implied Vol: 86.58%
IV Rank = 28.6%
Traders see a calm VIX and think there’s no edge. But remember: the IV percentile is low, not zero. And more importantly, single names are buzzing while index vol is asleep.
💡 Lesson: Don’t rely solely on VIX. The real edge right now lies in overbought single ETFs and inflated implied vol on individual stocks (especially into earnings).
The Best Opportunities, Backed by Data
Each week, we filter the ETF universe using six core indicators to uncover where the real opportunities lie for disciplined options traders:
IV Rank – Is volatility pricing high relative to the past year?
IV Percentile – Is implied vol near the top or bottom of its range?
Put/Call Ratio – Is sentiment bullish, bearish, or complacent?
RSI(2) – Micro-term stretch (great for timing fades)
RSI(7) – Short-term momentum sweet spot
RSI(14) – Longer-term overbought/oversold gauge
These signals offer a structured view of market stress, premium opportunity, and momentum extremes, without relying on guesswork.
Most Overbought + Highest IV:
Where volatility is overpriced and price action is stretched
Symbol | IV Rank | IV %ile | P/C Ratio | RSI(2) | RSI(7) | RSI(14) |
|---|---|---|---|---|---|---|
IBIT | 24.9 | 12.0 | 0.344 | 98.2 | 80.8 | 70.3 |
SLV | 45.1 | 65.1 | 0.192 | 94.5 | 77.7 | 70.0 |
SMH | 11.5 | 23.0 | 6.614 | 88.0 | 76.6 | 73.9 |
XLE | 15.3 | 19.2 | 0.736 | 86.3 | 68.8 | 62.4 |
URA | 47.3 | 21.2 | 0.941 | 76.0 | 53.1 | 59.3 |
XOP | 12.3 | 25.4 | 1.89 | 85.0 | 66.5 | 61.5 |
📚 Key Insight:
These names combine elevated implied volatility with stretched momentum across short and medium timeframes. When price runs hot and premium is rich, options tend to be overpriced relative to actual risk, a core signal for experienced premium sellers.
Balanced Momentum + Elevated Volatility
Names with strong RSI(7), moderate RSI(2), and high IV Rank
Symbol | IV Rank | IV %ile | P/C Ratio | RSI(2) | RSI(7) | RSI(14) |
|---|---|---|---|---|---|---|
QQQ | 9.8 | 22.3 | 1.200 | 39.5 | 64.6 | 66.4 |
SPY | 10.6 | 28.7 | 1.142 | 44.5 | 67.1 | 67.5 |
RSP | 21.2 | 14.7 | 0.659 | 35.2 | 61.0 | 62.7 |
XBI | 16.7 | 28.2 | 1.101 | 45.6 | 63.6 | 61.9 |
XLI | 7.2 | 28.8 | 1.576 | 55.9 | 73.5 | 70.7 |
📚 Key Insight:
These names are approaching a momentum peak, with rising RSI(7) and IV that’s creeping higher. Not quite overbought yet, but nearing potential exhaustion.
Also This Week: Earnings Season Begins
Big banks like JPM, C, WFC kick off this quarter’s earnings. These events come with:
Elevated implied volatility
Well-defined expected moves
IV crush opportunities post-announcement
💡 Keep an eye on volatility spikes heading into reports, single-name setups will become increasingly attractive, especially for short-dated premium harvesters.
📊 Quick Reference: The Implied Truth Table
Field | Meaning |
|---|---|
P/C Ratio | Put/Call ratio: >1 = bearish skew, <1 = bullish bias, extremes may signal contrarian trades |
Impl Vol | Implied Volatility: higher IV = richer premiums, more expected movement |
IV Rank | IV vs. past year’s range (0–100%), >35% often favors premium-selling |
IV Percentile | % of time IV has been below current level, helps confirm if volatility is elevated |
RSI (2/7/14) | Momentum reading: >80 = overbought, <20 = oversold, shorter RSIs react faster |
📚 Educational Corner: Options Deep Dive
Using Expected Move to Optimize Strike Prices in the Wheel Strategy: A Masterclass in Options Trading
This week, we take a practical deep dive into one of the most effective tools available to income traders: the expected move. If you're using the Wheel Strategy, selling cash-secured puts and covered calls, selecting strike prices aligned with market probabilities can make or break your results.
In this article, you'll learn:
What the expected move is, how it's calculated, and why it matters
How to use it to set put strikes that maximize income while managing assignment risk
How to select call strikes that protect your shares and optimize return
Real-world examples, including a full trade sequence on Apple (AAPL)
Common mistakes traders make when selecting strikes, and how to avoid them
The expected move isn’t about prediction, it’s about stacking probabilities in your favor and letting time decay do the heavy lifting. This guide will help you use it as a cornerstone of a consistent, disciplined income strategy.
👉 Read the full article here: Using Expected Move to Optimize Strike Prices in the Wheel Strategy: A Masterclass in Options Trading
🔗 Let’s Stay Connected
Have questions, feedback, or just want to say hello? I’d love to hear from you.
📩 Email me anytime at [email protected]
Thanks again for reading. I hope you found today’s insights valuable and worth your time.
Trade Smart. Trade Thoughtfully.
Andy Crowder
Founder | Editor-in-Chief | Chief Options Strategist
The Option Premium
Reply