- The Option Premium
- Posts
- Credit Spread Strike Selection: A Probability-Based Approach
Credit Spread Strike Selection: A Probability-Based Approach
Learn the probability-based framework for selecting credit spread strikes using delta. Covers the 0.15-0.25 delta sweet spot, how IV environment shifts your target, a 5-step selection process, and a P/L payoff diagram.

Andrew Crowder
March 15, 2026

Credit Spread Strike Selection: A Probability-Based Approach
Strike selection is where credit spreads are won or lost. Not at management. Not at exit. At entry. The strikes you choose determine your probability of profit, your return on capital, your breakeven distance, and your risk-reward ratio before a single day passes. Get the strikes right and management becomes routine. Get them wrong and no amount of adjusting will save a trade that was flawed from the start.
Most traders select strikes by looking at the options chain, finding a premium that "looks good," and clicking. That's not a system. A probability-based approach uses delta as the primary selection tool, then layers on secondary filters to confirm the trade is worth taking. Here's the complete framework.
Why Delta Is Your Strike Selection Tool
Delta serves two purposes in options trading. It measures how much an option's price changes per $1 move in the stock, and it approximates the probability that the option expires in the money. For credit spread sellers, it's the second function that matters most.
When you sell a 0.20 delta put, you're selecting a strike that has roughly a 20% chance of expiring ITM, which means an 80% chance of expiring OTM and letting you keep the premium. When you sell a 0.30 delta put, you've moved that probability to 70/30. When you sell a 0.10 delta put, you're at 90/10.
This is the foundation of probability-based strike selection: instead of asking "which strike pays me the most?", you ask "which strike gives me the probability profile I want, and does the premium justify the risk at that probability?"
The difference matters. Chasing premium leads you to higher-delta strikes where the odds of success are lower. Chasing probability leads you to lower-delta strikes where the premium may not compensate for the risk. The sweet spot lives in between, and finding it consistently is what separates mechanical traders from profitable ones.
The Delta Sweet Spot: 0.15 to 0.25
After thousands of credit spread trades, I've settled on the 0.15 to 0.25 delta range as the optimal zone for selling credit spreads. Here's why this range works and what happens when you go outside it.
0.10 delta and below (90%+ POP). Extremely high probability, but the premiums are thin. A 0.10 delta put on a $200 stock might pay $0.40 on a $5 wide spread. Your return on capital is 8.7% ($0.40 / $4.60), which means you need 12 consecutive winners just to recover from one max loss. The math erodes over time. You'll win often and feel great, until one loss wipes out months of gains.
0.15 delta (approximately 85% POP). The conservative end of the sweet spot. Premiums are modest but meaningful. Typical ROC: 20-30%. You win roughly 85 out of 100 trades. The occasional loss is manageable because each winning trade contributes enough to absorb it. This is where I operate when IV Rank is moderate (20-35) or when I want wider margin for error.
0.20 delta (approximately 80% POP). The balanced center of the sweet spot. This is my default starting point. Premiums are solid, probability is high, and the breakeven distance provides meaningful cushion. Typical ROC: 30-40%. Over a large sample, the win rate and per-trade return produce the best risk-adjusted returns.
0.25 delta (approximately 75% POP). The aggressive end of the sweet spot. Premium is richer, but you're losing roughly 1 in 4 trades. Typical ROC: 40-55%. The higher per-trade income compensates for the lower win rate, but the drawdowns are deeper and more frequent. This is where I operate when IVR is elevated (above 40) and the extra premium adequately compensates for the additional risk.
0.30 delta and above (70% POP or less). You've left the sweet spot. At 0.30 delta, you're losing 30 out of 100 trades. The premium looks attractive, but the frequency of losses creates drawdown sequences that test your mental capital. Over 100 trades at 0.30 delta, you'll experience stretches of 3-4 consecutive losses. Most traders abandon their strategy during these stretches. If you can't sit through that, stay at 0.20.
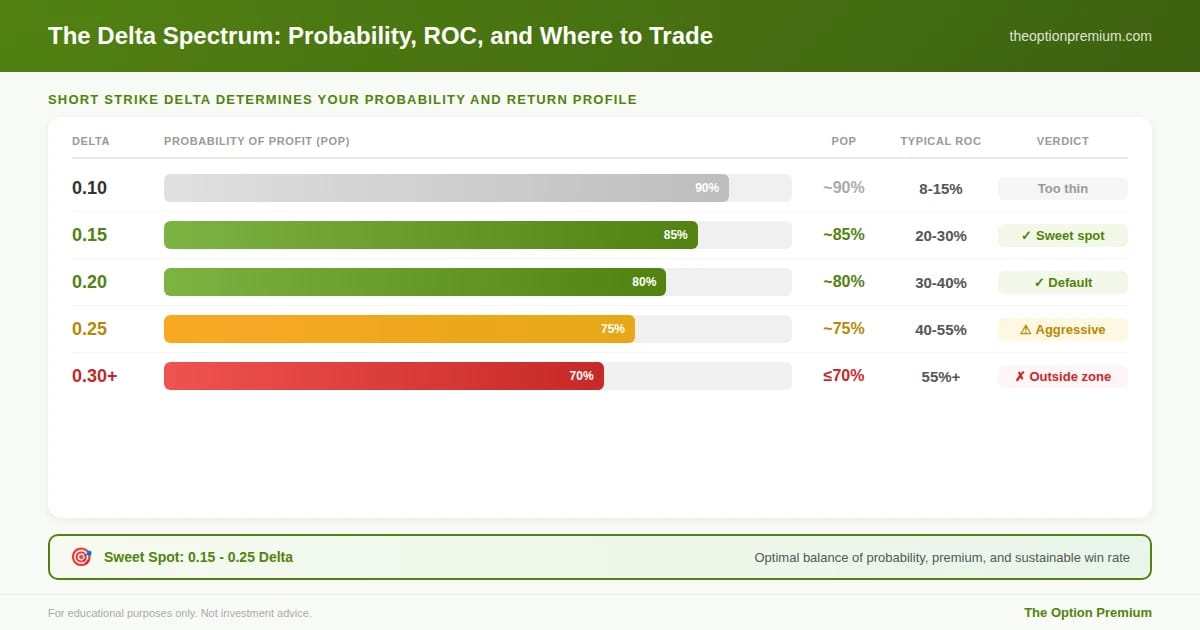
The delta spectrum for credit spread sellers. At 0.10 delta (90% POP), premiums are too thin and ROC runs 8-15%. The sweet spot lives at 0.15-0.25 delta: 0.15 gives ~85% POP with 20-30% ROC (conservative), 0.20 gives ~80% POP with 30-40% ROC (default), 0.25 gives ~75% POP with 40-55% ROC (aggressive). Above 0.30, loss frequency creates unsustainable drawdowns.
From Delta to Dollars: The Complete Selection Process
Selecting the short strike by delta is step one. The complete process layers four additional filters on top.
Step 1: Select the short strike by delta. Open the options chain at your target expiration (30-45 DTE). Find the put (for bull put spreads) or call (for bear call spreads) closest to your target delta. This is your short strike.
Step 2: Choose your spread width. The distance between your short and long strikes defines your maximum risk. I use $5 wide spreads on underlyings under $200 and $10 wide on underlyings above $200. Wider spreads collect slightly more credit but increase your max loss proportionally. The width should be consistent within your strategy so you're comparing apples to apples across trades.
Step 3: Calculate return on capital. Net credit divided by maximum loss. If the ROC is below 25%, the premium doesn't adequately compensate for the risk. Move on. This usually happens when IV is too low to sell credit spreads profitably, and the filter saves you from mediocre trades.
Step 4: Check breakeven distance. How far does the stock need to move before you start losing money? For bull put spreads, subtract the net credit from the short strike and compare that to the current stock price. I want at least a 4-5% buffer. Less than that and normal stock fluctuation can threaten the position.
Step 5: Confirm the IV environment. IV Rank above 30 means options are priced on the richer side of their historical range. This ensures your delta-selected strike is paying enough premium to justify the trade. Below IVR 30, the same 0.20 delta strike might pay a credit that fails the ROC check in Step 3.
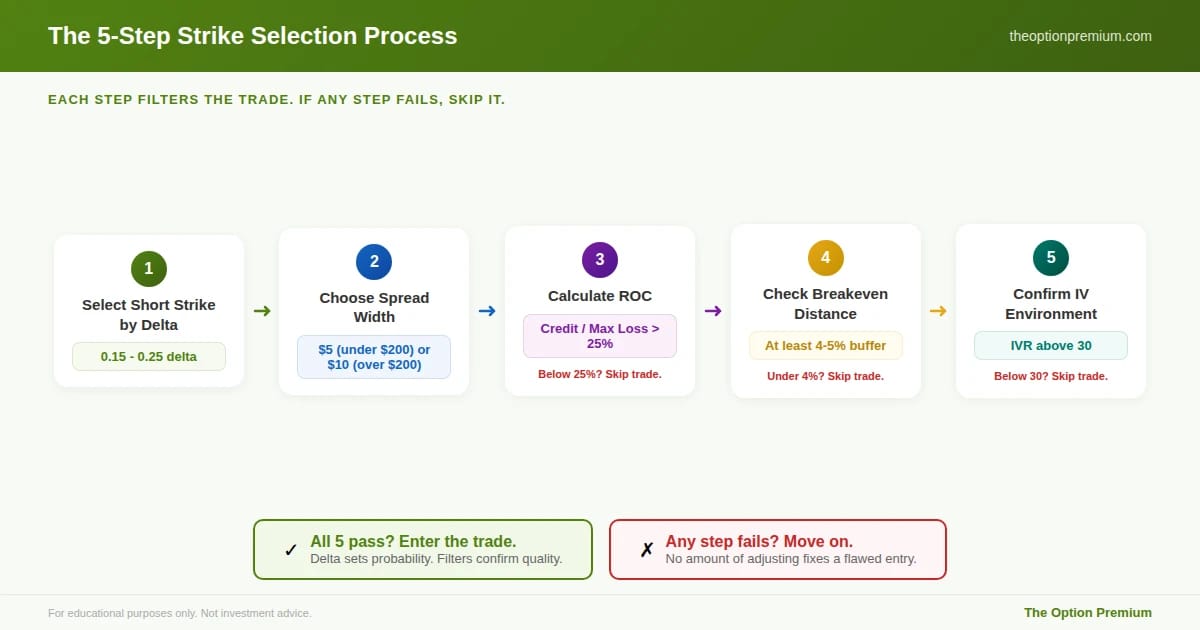
The five-step strike selection process as a sequential flow. (1) Select short strike by delta (0.15-0.25). (2) Choose spread width ($5 under $200, $10 over). (3) Calculate ROC (must clear 25%). (4) Check breakeven distance (at least 4-5% buffer). (5) Confirm IV environment (IVR above 30). All five pass: enter the trade. Any step fails: move on.
How IV Environment Shifts Your Strike Selection
Implied volatility doesn't just affect how much premium you collect. It changes which delta you should target. The relationship is practical and worth understanding.
Low IV (IVR under 20). Premiums are thin across the board. Even a 0.25 delta strike might fail the 25% ROC minimum. In this environment, I typically don't sell credit spreads at all. The risk-reward doesn't work. If you insist on trading, you'll be pushed toward higher deltas (0.30+) to collect enough premium, which drops your probability below the sweet spot. Better to wait for volatility to expand.
Moderate IV (IVR 20-40). This is where most of your trades will occur. Target the 0.15-0.20 delta range. Premiums are adequate, probabilities are high, and the ROC should clear 25-30% on well-selected underlyings. This is the bread-and-butter environment.
Elevated IV (IVR 40-60). Premiums are rich. You can afford to be more conservative. Target 0.15 delta or even 0.12 delta and still collect meaningful premium. The wider breakeven cushion in elevated-IV environments is valuable because the market is pricing in larger moves for a reason.
Extreme IV (IVR above 60). Proceed with caution. Premiums are very rich, but extreme IV usually means the market expects a significant event (earnings, FDA, macro shock). The probability approximation from delta becomes less reliable when tail risk is elevated. If you sell here, go conservative: 0.10-0.15 delta, wider spreads, and smaller position sizes. Or simply wait for the event to pass and sell into the IV crush afterward.
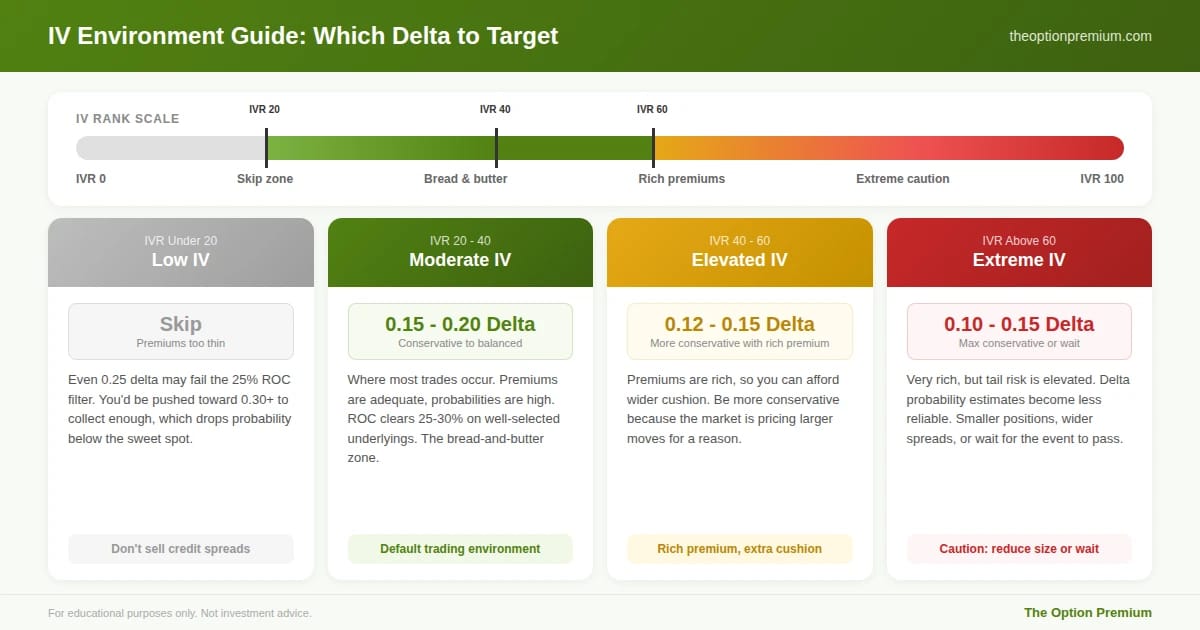
IV environment determines which delta to target. Low IV (IVR under 20): skip credit spreads entirely, premiums too thin. Moderate IV (IVR 20-40): target 0.15-0.20 delta, the bread-and-butter zone. Elevated IV (IVR 40-60): go more conservative at 0.12-0.15 delta, rich premiums allow wider cushion. Extreme IV (IVR above 60): caution, reduce size or wait for the event to pass.
Breakeven Distance: The Buffer That Protects You
Breakeven distance is the most underappreciated metric in credit spread selection. It tells you how much room the stock has to move against you before you start losing money.
Calculating breakeven distance. For a bull put spread: (Current Stock Price minus Breakeven Price) divided by Current Stock Price, expressed as a percentage. If a stock is at $200 and your breakeven is $188.50, your buffer is 5.75%.
Why 4-5% minimum matters. Stocks regularly fluctuate 3-5% over a 30-day period during normal market conditions. A breakeven buffer under 4% means routine stock movement can threaten your position. Above 5%, you have meaningful room for the stock to pull back without touching your profit zone.
Breakeven distance varies by underlying. A 5% move in SPY is a significant market event. A 5% move in a small-cap biotech stock is a Tuesday afternoon. Match your breakeven expectations to the underlying's typical movement range. Check the stock's average true range (ATR) over the past 30 days and make sure your breakeven is at least 1.5x the ATR away from the current price.
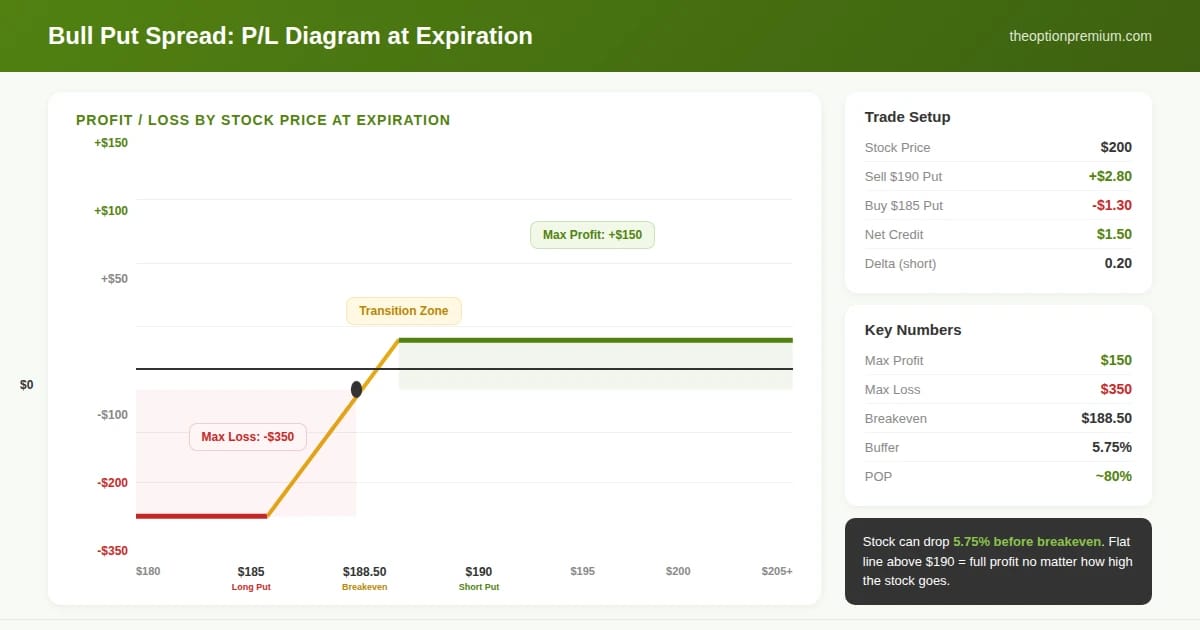
The P/L payoff diagram for a $190/$185 bull put spread on a $200 stock, sold for $1.50 credit. Below $185: max loss of $350 (flat line). Between $185 and $190: transition zone. Breakeven at $188.50 (5.75% buffer). Above $190: max profit of $150 (flat line extending to the right). The stock can drop 5.75% before you start losing money.
The Practitioner Edge: Matching Strikes to Market Conditions
Strike selection isn't static. The best traders adjust their approach based on what the market is doing.
Trending market (up or down). In a strong trend, the side of the spread that goes with the trend is safer. In an uptrend, bull put spreads at 0.15-0.20 delta have the trend working in their favor. Bear call spreads in the same uptrend carry more risk. Lean into the trend or reduce position size on the counter-trend side.
Choppy, range-bound market. This is iron condor territory, but if you're selling single credit spreads, stay conservative at 0.15 delta. Range-bound markets can have sharp moves within the range that test your short strikes before reverting. The extra probability cushion at 0.15 delta helps absorb these whipsaws.
Post-earnings or post-event. After a binary event, IV typically crushes. Selling credit spreads immediately after the event captures the IV decline as an additional tailwind. You can be slightly more aggressive (0.20-0.25 delta) because the catalyst that was keeping IV elevated has passed.
Market pullback. Pullbacks create opportunity for put sellers. IV rises during pullbacks, enriching premiums. But don't sell into a falling knife. Wait for the first sign of stabilization (a green day, support holding, VIX peaking) before selling bull put spreads. When you do sell, the elevated IV means your 0.20 delta strike is further from the money in dollar terms, giving you extra cushion.
Common Strike Selection Mistakes
Selecting by premium, not by delta. "I want to collect at least $1.50" is not a selection method. It pushes you toward higher deltas in low-IV environments, where the probability of success doesn't justify the risk. Let delta lead. If the premium at your target delta is insufficient, skip the trade.
Ignoring the IV environment. The same 0.20 delta strike produces very different ROC in different IV environments. A 0.20 delta put on SPY might pay $1.20 when IVR is 40 but only $0.50 when IVR is 15. The delta is the same, but one trade clears your ROC filter and the other doesn't.
Static delta across all conditions. Always selling 0.20 delta regardless of IV, trend, or market conditions is mechanical but not optimal. Use the full 0.15-0.25 range and let the environment guide you toward the conservative or aggressive end.
Forgetting about the long strike. The long strike (your protective wing) matters. Narrow spreads ($2.50 wide) create tighter risk but require higher win rates because the ROC is often low. Wide spreads ($10+) collect more credit but expose you to larger max losses. Match spread width to your position-sizing framework.
Risk Reality Check
Even at 0.15 delta with an 85% probability of profit, you will have losing trades. Over 100 trades, expect 15 losses. Over 50 trades per year, that's 7-8 losses. They don't arrive evenly spaced. You might win 20 in a row and then lose 3 of the next 5. That's not your strategy failing. That's probability distributing normally.
The key is ensuring that your winners collectively outpace your losers. At 0.20 delta with 30-40% ROC, a trade risking $350 to make $150 needs to win at least 70% of the time to be profitable. At 80% POP, you have meaningful margin above breakeven. That's the edge. It's not huge, and it requires discipline to capture, but it's real and it compounds.
Key Takeaways
Delta is your primary strike selection tool. It tells you the approximate probability that the option expires ITM. For credit spreads, target the 0.15-0.25 delta range on your short strike, which translates to 75-85% probability of the spread expiring worthless.
The 0.20 delta default is the balanced center of the sweet spot. Below 0.15, premiums are too thin. Above 0.25, loss frequency creates drawdowns most traders can't sustain. Adjust within the range based on IV environment and market conditions.
Layer four filters after selecting by delta: spread width (consistent sizing), ROC above 25%, breakeven distance of at least 4-5%, and IV Rank above 30. If any filter fails, skip the trade.
Match your delta to the IV environment. Low IV (skip or go wider), moderate IV (0.15-0.20 delta), elevated IV (0.15 delta for extra cushion with rich premium), extreme IV (caution, smaller size, or wait for the event to pass).
Track your results across delta targets. Your optimal delta depends on your account size, risk tolerance, and ability to sit through losing streaks. The data from your own trades will tell you more than any theory.
Probability doesn't guarantee any single outcome. It guarantees that over a large enough sample, the math works. Select strikes that put the math on your side, then let the sample size do the rest.
Andy Crowder
📩 Want to see how a 24+ year professional options trader approaches the market?
Subscribe to The Option Premium, my free weekly newsletter where I share:
Probability-based strategies that actually work: credit spreads, cash-secured puts, the wheel, LEAPS, poor man's covered calls, and more
Real trade breakdowns with the math behind every decision
Market insights for any environment, whether we're grinding higher, pulling back, or chopping sideways
No hype. No predictions. Just the frameworks I've used to trade options for over two decades.
📺 Want more? Follow me on YouTube for in-depth tutorials, live trade analysis, and the kind of education you won't find anywhere else.
Connect with me:
This newsletter is for educational purposes only and should not be considered investment advice. Options trading involves significant risk and is not suitable for all investors. Past performance does not guarantee future results. Always consult with a qualified financial professional before making investment decisions.
Reply