- The Option Premium
- Posts
- How to Read an Options Chain: A Beginner's Visual Guide
How to Read an Options Chain: A Beginner's Visual Guide
Learn how to read an options chain in plain English. Visual guide covering the 5 key columns (bid, ask, last, volume, open interest), ITM vs OTM, and a 5-step walkthrough for your first trade.

Andrew Crowder
March 01, 2026
How to Read an Options Chain: A Beginner's Visual Guide
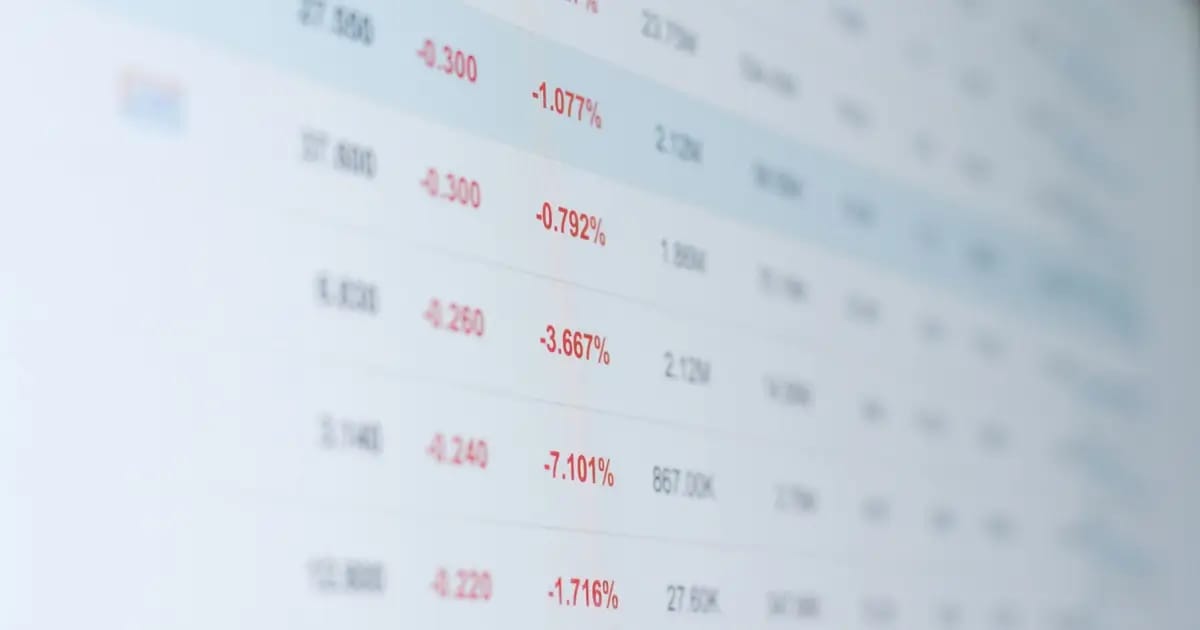
The first time most people open an options chain, they close it almost immediately. Rows of numbers, Greek letters, color-coded columns, and strike prices stretching in both directions. It looks like a spreadsheet designed by someone who wanted to keep beginners out.
But here's what nobody tells you: an options chain is just a menu. It lists everything available for purchase or sale, organized by price and expiration date. Once you know what each column means and where to look, reading an options chain becomes as routine as checking a stock quote. Let's break it apart, piece by piece.
The Big Picture: What You're Looking At
An options chain displays all available option contracts for a specific stock or ETF, organized by expiration date. When you pull up an options chain on your broker's platform, you'll typically see:
Expiration tabs across the top. Each tab represents a different expiration date. You might see weekly expirations, monthly expirations, or LEAPS stretching out a year or more. Click a tab to see all the contracts available for that date.
Calls on the left, puts on the right. This is the standard layout on most platforms. The left side shows call options, the right side shows put options. Some platforms flip this or let you toggle between them, but the split-screen layout is the most common.
Strike prices down the center. The strike price column runs vertically between the calls and puts. This is the price at which the option gives you the right to buy (calls) or sell (puts) the underlying stock. Strike prices are listed in order from lowest at the top to highest at the bottom.
Think of it like a restaurant menu where the left page is appetizers (calls), the right page is desserts (puts), and the center column is the price list (strikes). Everything branches out from there.

Anatomy of an options chain showing AAPL with calls on the left, strike prices in the center, puts on the right, expiration tabs across the top, and ITM shading
The Columns That Matter Most
Every options chain has a dozen or more columns, but as a beginner, you only need to focus on five. The rest can wait until you're more comfortable.
Bid. This is the highest price someone is currently willing to pay for the option. If you're selling an option, this is the price you'll receive. Think of it as the "I'll buy it for this much" number.
Ask. This is the lowest price someone is currently willing to sell the option for. If you're buying an option, this is the price you'll pay. The gap between bid and ask is called the spread, and tighter spreads mean better pricing for you.
Last. The most recent price at which the option actually traded. This can be stale if the option hasn't traded recently, so don't rely on it for pricing decisions. The bid and ask are always more current.
Volume. How many contracts have traded today. Higher volume generally means better liquidity, tighter bid-ask spreads, and easier execution. For beginners, sticking to options with volume above 100 contracts per day is a good starting filter.
Open Interest. The total number of contracts currently open and outstanding. This tells you how many traders are holding positions in that specific contract. Higher open interest, like higher volume, signals better liquidity. I look for open interest of at least 500 before entering a position.

Five key options chain columns explained for beginners: bid, ask, last, volume, and open interest with examples and definitions
In-the-Money vs. Out-of-the-Money
The options chain visually separates contracts that are in-the-money (ITM) from those that are out-of-the-money (OTM). Most platforms shade or highlight ITM options with a different background color.
For calls: a contract is ITM when the strike price is below the current stock price. If Apple is trading at $220 and you're looking at the $210 call, that's in-the-money by $10. The option has intrinsic value because you could exercise it and immediately buy shares below market price.
For puts: a contract is ITM when the strike price is above the current stock price. If Apple is at $220 and you're looking at the $230 put, that's in-the-money by $10.
At-the-money (ATM) options have a strike price closest to the current stock price. These typically have the highest time value and the most volume.
Out-of-the-money options have no intrinsic value. They consist entirely of time value, and they're cheaper because the stock would need to move in your direction for the option to have any worth at expiration.
As a premium seller, I spend most of my time looking at OTM options. That's where you find the probability edge. Selling an OTM option means you're betting the stock won't reach that strike, and the probabilities favor that outcome more often than not.
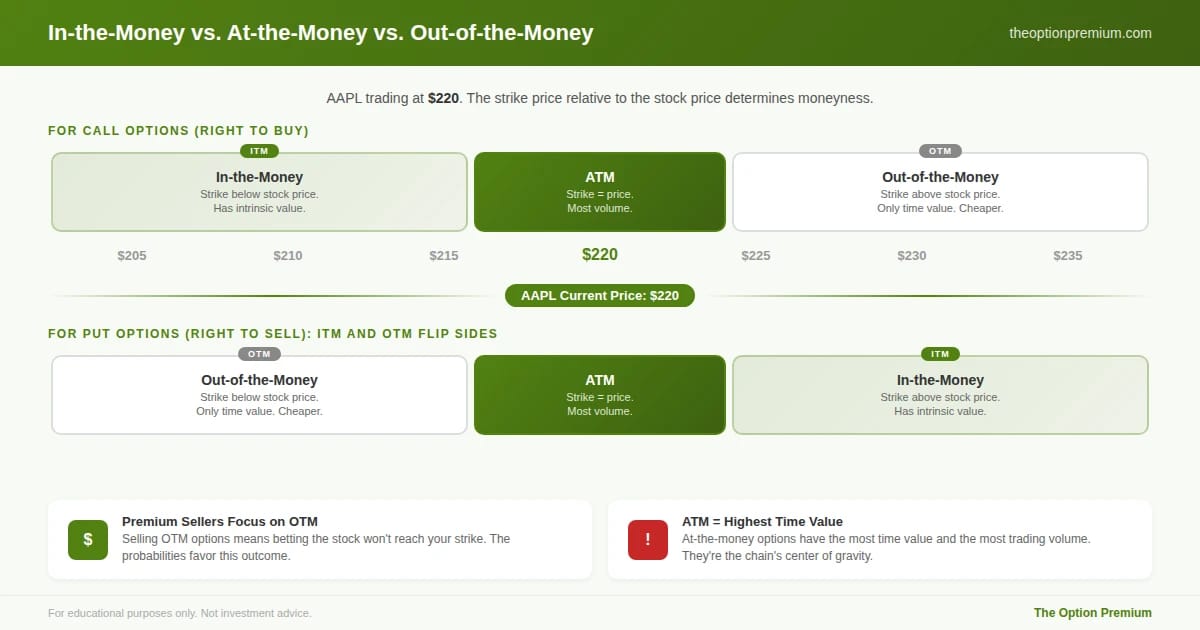
In-the-money vs at-the-money vs out-of-the-money options explained visually for both calls and puts with AAPL strike price examples
How to Use the Chain for Your First Trade
Let's walk through a practical example. Say you want to sell a cash-secured put on Apple, currently trading at $220.
Step 1: Choose your expiration. Select the tab for an expiration 30 to 45 days out. This is the theta decay sweet spot for premium sellers.
Step 2: Look at the put side (right side). Scroll to the OTM puts, which are the strikes below $220.
Step 3: Find your target delta. If your platform shows delta, look for a put with a delta between -0.15 and -0.25. That might be the $210 or $205 put, giving you a 75-85% probability of the option expiring worthless.
Step 4: Check the bid price. The bid tells you what you'll collect. If the $210 put shows a bid of $2.50, you'd receive $250 per contract.
Step 5: Check volume and open interest. Make sure there's enough liquidity. You want volume above 100 and open interest above 500 for clean execution.

Five steps to read an options chain for your first trade: choose expiration, find puts, target delta, check bid price, verify liquidity
That's the entire process. Five columns, five steps.
The Practitioner Edge: What the Chain Tells Me Beyond the Numbers
After 23+ years, I read options chains the way a meteorologist reads a radar map. The raw data is important, but the patterns tell a deeper story.
Wide bid-ask spreads are a warning. If the bid is $2.00 and the ask is $2.80, that's a $0.80 spread on a $2.00 option. That's 40% slippage. I avoid contracts where the spread is more than 10-15% of the mid-price. Liquidity matters more than premium size.
Unusual volume spikes signal something. When a specific strike suddenly shows 10x its normal volume, institutional money is positioning. I don't blindly follow, but I take notice.
The chain tells you implied volatility without looking at a separate screen. Compare the premiums across expirations. If 30-day options are priced significantly higher relative to 60-day options than usual, near-term IV is elevated. That's often a good time to sell premium.
Key Takeaways

An options chain is a menu of all available contracts organized by expiration (tabs across the top) and strike price (center column), with calls on the left and puts on the right.
The five columns that matter most for beginners: bid (what you receive when selling), ask (what you pay when buying), last (most recent trade), volume (today's activity), and open interest (total outstanding contracts).
In-the-money options have intrinsic value. Out-of-the-money options are cheaper and consist entirely of time value. Premium sellers focus on OTM options for the probability edge.
Always check liquidity before entering a trade. Volume above 100 and open interest above 500 are good minimum filters. Wide bid-ask spreads eat into your returns.
Reading the chain gets easier with practice. Start by identifying one trade setup, walk through the five steps, and the layout will feel natural within a few sessions.
Your Next Step
Open your broker's platform right now and pull up the options chain on a stock you know well. Don't trade anything. Just practice identifying the five key columns, finding the ATM strike, and distinguishing ITM from OTM contracts. The chain only looks intimidating the first time you see it.
Every expert was once a beginner who refused to close the tab.
Andy Crowder
📩 Want to see how a 24+ year professional options trader approaches the market?
Subscribe to The Option Premium, my free weekly newsletter where I share:
Probability-based strategies that actually work: credit spreads, cash-secured puts, the wheel, LEAPS, poor man's covered calls, and more
Real trade breakdowns with the math behind every decision
Market insights for any environment, whether we're grinding higher, pulling back, or chopping sideways
No hype. No predictions. Just the frameworks I've used to trade options for over two decades.
📺 Want more? Follow me on YouTube for in-depth tutorials, live trade analysis, and the kind of education you won't find anywhere else.
Connect with me:
This newsletter is for educational purposes only and should not be considered investment advice. Options trading involves significant risk and is not suitable for all investors. Past performance does not guarantee future results. Always consult with a qualified financial professional before making investment decisions.
Reply