- The Option Premium
- Posts
- The Theta Decay Sweet Spot: Why 30-60 DTE Is Where Premium Sellers Make Their Money
The Theta Decay Sweet Spot: Why 30-60 DTE Is Where Premium Sellers Make Their Money
Theta decay accelerates toward expiration. So does gamma. The ratio between them is most favorable between 30-60 DTE. The mathematical case for the professional premium seller's window, with the theta curve, gamma profile, and probability mechanics.

Andrew Crowder
May 02, 2026

The Theta Decay Sweet Spot: Why 30-60 DTE Is Where Premium Sellers Make Their Money
There's a reason professional premium sellers cluster their entries between 30 and 60 days to expiration. It's not tradition. It's not preference. It's mathematics. The theta decay curve, the gamma exposure profile, and the probability mechanics of options all converge to create a window where selling premium produces the best risk-adjusted returns available in the options market.
Shorter-dated options, whether weeklys or the increasingly popular 0DTE contracts, offer higher annualized theta per day. That sounds attractive on paper. But annualized theta is not the same as risk-adjusted theta, and the difference between those two concepts is the difference between a sustainable trading career and a portfolio that implodes during a single adverse session.
This article is the mathematical case for the 30-60 DTE window. No opinions. No preferences. Just the numbers, the curves, and the probabilities that explain why this window works.
The Theta Decay Curve Is Not Linear
The most important chart in options theory is the one most traders misunderstand. Theta decay, the rate at which an option loses value due to the passage of time, is not a straight line. It's a curve that accelerates as expiration approaches.
An at-the-money option with 60 days to expiration might decay at $3 per day. The same option at 30 DTE might decay at $5 per day. At 14 DTE, $8 per day. At 7 DTE, $12 per day. At 1 DTE, $25 per day. The daily theta increases as you move toward expiration because the time value evaporates at an accelerating rate.
This acceleration is what makes weekly and 0DTE options seductive. The theta per day is dramatically higher. A 0DTE at-the-money option might have a theta of $40, compared to $5 on the 45 DTE equivalent. Sellers look at that $40 and see eight times the daily income.
But theta is not free income. Theta is compensation for risk. And the risk that theta compensates you for, gamma, accelerates on exactly the same curve.
The Gamma Problem: What Theta Doesn't Tell You
Gamma measures how quickly delta changes as the stock moves. For a premium seller, gamma is the enemy. High gamma means that a $1 move in the stock produces a larger change in your position's delta, which means a larger change in your P&L. Gamma is the reason small moves near expiration produce outsized losses.
Here's the critical relationship: gamma and theta are inversely related for premium sellers. They're two sides of the same coin. High theta compensates you for high gamma. Low theta corresponds to low gamma. The market is not giving you free money with high theta. It's charging you with high gamma simultaneously.
At 45 DTE, a $1 adverse move in the underlying might change your position's delta by 2-3 points. At 7 DTE, the same $1 move might change delta by 8-12 points. At 1 DTE, by 20-30 points. The option becomes increasingly sensitive to every tick in the stock as expiration approaches.
This is why the 30-60 DTE window produces the best risk-adjusted returns. Theta is accelerating but hasn't reached the parabolic zone. Gamma is present but manageable. The ratio of theta collected to gamma risk assumed is most favorable in this window. You're capturing meaningful daily decay while maintaining a position that can withstand normal market fluctuations without requiring constant attention or producing panic-inducing P&L swings.
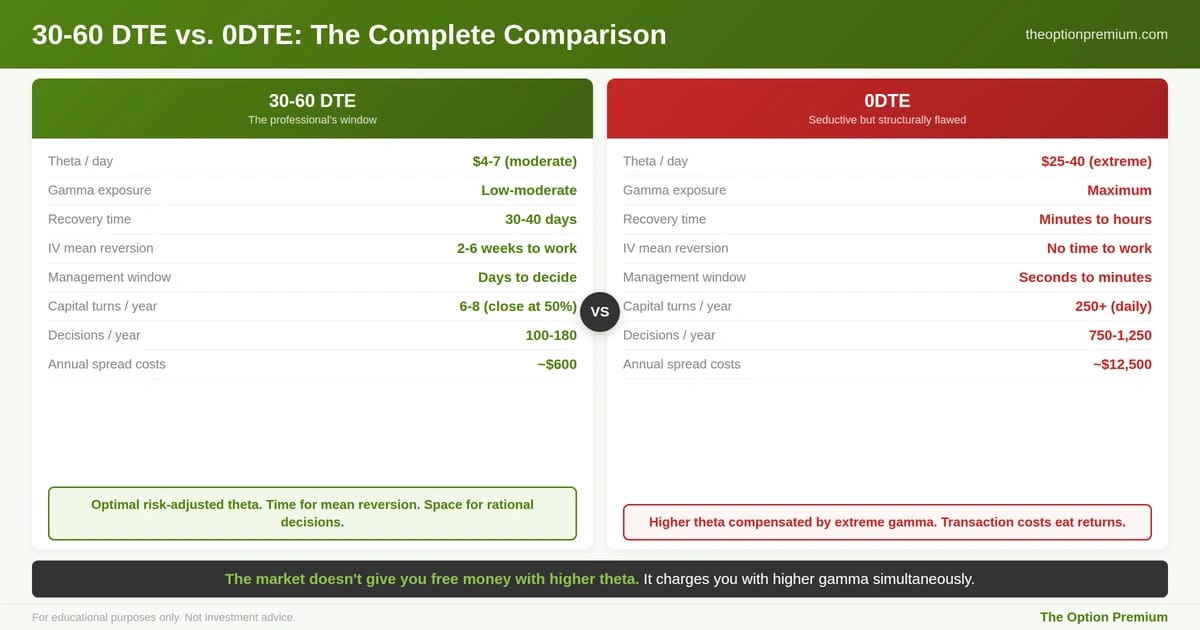
The complete comparison across eight dimensions. 30-60 DTE: $4-7/day theta, low gamma, 30-40 days recovery, days to manage, 100-180 decisions/year, ~$600 annual costs. 0DTE: $25-40/day theta, extreme gamma, minutes to recover, seconds to manage, 750+ decisions/year, ~$12,500 annual costs. Same underlying market. Radically different risk and behavioral profiles.
The Probability Mechanics at 30-60 DTE
Probability of profit on a credit spread is a function of delta, time, and volatility. At 30-60 DTE, these three factors interact in ways that favor the premium seller.
Time provides a buffer for mean reversion. A stock that moves against your position at 45 DTE has 30-40 days to mean revert before any management decision becomes critical. That same adverse move at 7 DTE has almost no time for recovery. At 0DTE, there is literally zero recovery window. Every adverse move is permanent within the trade's lifetime.
Implied volatility mean reversion works in your favor. IV tends to revert to its mean over 2-6 week periods. Selling premium at elevated IV Percentile gives you 30-60 days for that mean reversion to work. If you sold at IVP 65 and it reverts to IVP 45 over the next three weeks, your position benefits from both theta decay and vega contraction. Weekly options don't provide enough time for IV mean reversion to contribute meaningfully to the trade.
The expected move calculation is more reliable. The market's estimate of a stock's movement over 45 days is statistically more stable than its estimate over 1 or 5 days. Short-dated expected moves are more susceptible to individual events, gap risk, and intraday volatility spikes. The law of large numbers applies to time as well as to trade count: more days in the trade means more opportunity for the statistical distribution to assert itself.
The Theta-to-Gamma Ratio: The Metric That Matters
If you want to quantify why 30-60 DTE is optimal, look at the theta-to-gamma ratio of any at-the-money option across different expirations.
At 60 DTE, the theta/gamma ratio might be 0.8. At 45 DTE, it's approximately 1.0. At 30 DTE, it's approximately 1.2. At 14 DTE, it's approximately 1.5. At 7 DTE, it's approximately 2.0. At 1 DTE, it's approximately 3.5.
The ratio increases as expiration approaches, which appears to favor shorter dates. But the ratio doesn't capture the asymmetry. Gamma risk is non-linear. A $2 move against you at 7 DTE produces a delta change roughly 3-4x what the same move produces at 45 DTE. The theta you collect at 7 DTE compensates you for that gamma risk on average, but the distribution of outcomes is fat-tailed: most days are fine, but the occasional gap or intraday reversal produces a loss that wipes out a week's worth of theta collection.
The 30-60 DTE window is where the theta-to-gamma ratio is high enough to produce meaningful income but low enough that gamma doesn't dominate your risk profile. You're collecting $4-6 per day per contract on a position that can absorb a $2-3 adverse move without threatening your management rules. That's the sweet spot.
The Practical Translation: What This Means for Your Process
The mathematical advantages of 30-60 DTE translate directly into practical trading benefits.
You can close at 50% of max profit and redeploy. A 45 DTE credit spread that reaches 50% of max profit in 15-20 days gives you the opportunity to close, free the capital, and redeploy into a new position. This "turn" of capital happens 2-3 times per 60-day cycle. Each turn captures the middle portion of the theta curve where decay is meaningful but gamma hasn't spiked. Over a year, 6-8 turns of the same capital through the 30-60 DTE window produces more total theta collected than holding a single position to expiration.
You have time to manage without urgency. At 45 DTE, a position that moves against you can be rolled, adjusted, or closed over the course of days. There's no need to make split-second decisions during market hours. The 30-60 DTE window gives you management optionality that doesn't exist in weekly or 0DTE timeframes.
Position sizing is meaningful at normal account sizes. A 45 DTE credit spread on a $150 stock might have a $300 max loss per contract. At 2-5% position sizing, a $50,000 account can run 3-8 of these simultaneously across different underlyings. Weekly and 0DTE options often have such thin premiums that you need more contracts (and more capital exposure) to generate meaningful income, which concentrates risk in ways that defeat the purpose of probability-based selling.
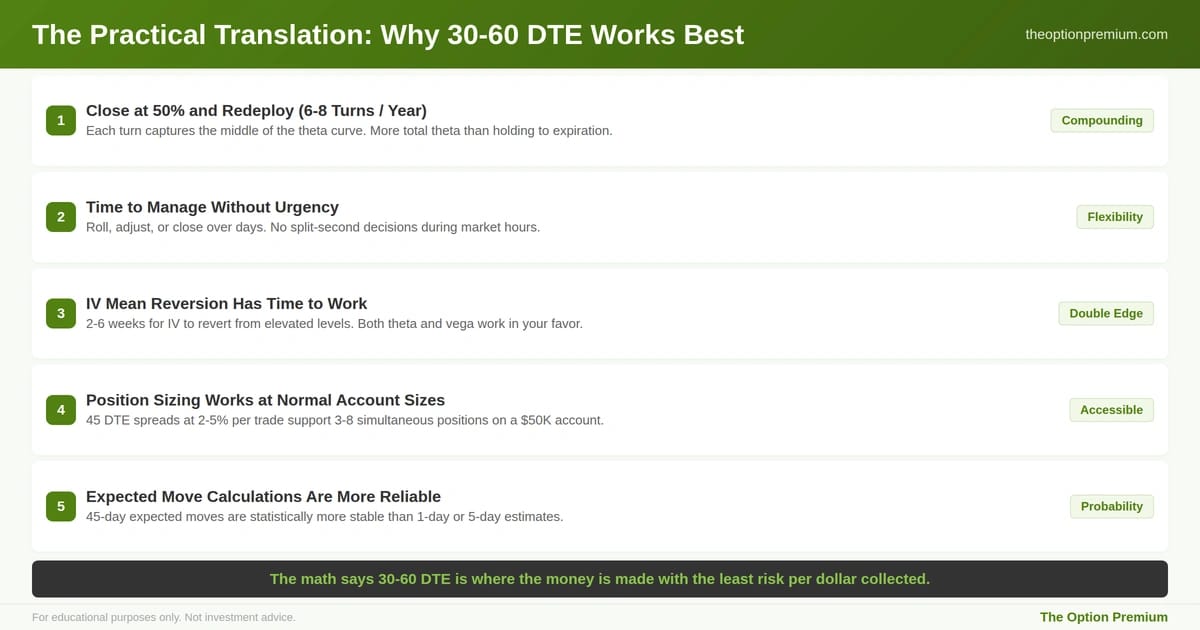
The math translates into five practical advantages. Closing at 50% profit and redeploying creates 6-8 capital turns per year through the optimal portion of the decay curve, producing more total theta than holding to expiration. Management decisions happen over days, not minutes. IV mean reversion contributes to profits over 2-6 weeks. Position sizing works at normal account sizes. Expected move calculations over 45 days are statistically more stable than 1-day estimates.
What the 30-60 DTE Window Is Not
This window is not guaranteed to outperform every other timeframe in every market condition. During extended low-volatility regimes, 30-60 DTE options produce thin premiums that may not justify the capital commitment. During extreme volatility events, even 45 DTE positions can gap through strikes.
The advantage is statistical and structural, not absolute. Over hundreds of trades across multiple market cycles, the 30-60 DTE window produces the most favorable combination of theta collection, gamma management, IV mean reversion, and management flexibility available to premium sellers. Individual trades within this window will lose. The aggregate performance across many trades is where the mathematical edge manifests.
Key Takeaways
Theta decay is not linear. It accelerates as expiration approaches, creating the illusion that shorter-dated options offer better daily income. But theta compensates for gamma, and gamma accelerates on the same curve. The risk you take to earn higher theta at 7 DTE or 0DTE is gamma that can produce outsized losses on any single adverse move.
The 30-60 DTE window is where the theta-to-gamma ratio is most favorable. You're collecting meaningful daily decay ($4-6 per contract per day) while maintaining manageable gamma exposure that allows positions to absorb normal market fluctuations without constant monitoring.
Time provides a buffer for mean reversion. At 45 DTE, a stock and its IV have 30-40 days to mean revert. At 7 DTE, the recovery window barely exists. At 0DTE, every adverse move is permanent within the trade's lifetime. The 30-60 DTE window lets the statistical distribution of outcomes work in your favor.
The practical benefits reinforce the math. Closing at 50% profit and redeploying produces 6-8 capital turns per year through the sweet spot of the decay curve. Management decisions happen over days, not minutes. Position sizing works at normal account sizes without requiring contract stacking.
The 30-60 DTE advantage is statistical, not absolute. It produces the best risk-adjusted returns across hundreds of trades over multiple market cycles. Individual trades within this window will lose. The aggregate is where the edge compounds.
The theta decay curve doesn't care about your preference for excitement or your desire for daily income. It follows a mathematical function that peaks in risk-adjusted favorability between 30 and 60 days to expiration. Professional premium sellers don't choose this window because it's interesting. They choose it because the math says it's where the money is made with the least amount of risk per dollar collected.
Andy Crowder
📩 Want to see how a 24+ year professional options trader approaches the market?
Subscribe to The Option Premium, my free weekly newsletter where I share:
Probability-based strategies that actually work: credit spreads, cash-secured puts, the wheel, LEAPS, poor man's covered calls, and more
Real trade breakdowns with the math behind every decision
Market insights for any environment, whether we're grinding higher, pulling back, or chopping sideways
No hype. No predictions. Just the frameworks I've used to trade options for over two decades.
📺 Want more? Follow me on YouTube for in-depth tutorials, live trade analysis, and the kind of education you won't find anywhere else.
Connect with me:
This newsletter is for educational purposes only and should not be considered investment advice. Options trading involves significant risk and is not suitable for all investors. Past performance does not guarantee future results. Always consult with a qualified financial professional before making investment decisions.
Reply