- The Option Premium
- Posts
- 📩 The Option Premium Weekly Issue - July 27, 2025
📩 The Option Premium Weekly Issue - July 27, 2025
Another Day, Another High - Too Far, Too Fast?
Every week, I write this for traders who are tired of the noise, those who want defined risk, clear mechanics, and a realistic path to consistent returns.
No hype. No fluff. Just proven strategies I’ve refined over 23+ years managing real capital.
I don’t run ads. I’m not selling dreams. This publication runs entirely on one thing: reader support.
💸 Real Results, Real Traders
Since launching The Income Foundation just under three months ago, we’ve closed 8 straight winning trades:
📈+1.53% average return per trade
📆 27.3-day average holding period
📊 23.0% annualized return, using real durations and real capital management
That’s $623 (per contract) in documented gains from just $27 in subscription costs.
This isn’t about chasing home runs, it’s about compounding steady income with smart, repeatable systems.
🔧 More Than One Way to Grow
Our Wealth Without Shares service takes it a step further with five Poor Man’s Covered Call portfolios, targeting All-Weather ETFs, dividend stocks, small-cap growth, and more.
So far:
✔️ 9 active PMCC trades
✔️ Average stock return: +7.4%
✔️ Average PMCC return: +20.2%
That’s the power of structured leverage + consistent short-call income.
🙌 Can’t Subscribe Right Now?
No problem, here’s how you can still help:
Forward this issue to a trader who wants structure over speculation
Post a quote or trade idea on X and tag @TheOptPremium
Bookmark www.theoptionpremium.com to explore real, practical options education
Mention us in your favorite Discord, Reddit, or Facebook group
This newsletter grows by word-of-mouth. No ads. No affiliates. Just real traders helping real traders.
👉 If you're ready for real-time alerts, full model portfolios, and deeper trade breakdowns, join us:
The Income Foundation – $9/month
Wealth Without Shares – $49/month
The Implied Perspective – $129/month
…. or sign-up for Total Access - $149/month
Thanks for reading and for spreading the word. I truly appreciate it!
📉 Market Snapshot and Commentary
Another Day, Another High - Too Far, Too Fast?
Markets continued their summer climb last week, with the S&P 500 posting another gain and notching its 12th record close in 30 days. The drivers? Ongoing trade optimism, better-than-expected earnings, and hopes for rate cuts as early as September. But with a critical week ahead, packed with Fed policy, jobs data, and big-tech earnings, the calm could be tested.
🌍 Trade Clarity Reduces Market Uncertainty
New trade deals, including a major agreement with Japan, are helping lift the tariff cloud. Agreements with the UK, Vietnam, China, and now the EU have followed, reducing the risk of another April-style selloff. Tariffs are rising, but the feared economic hit has yet to materialize, and businesses are beginning to plan again.
📊 The Economy: Goldilocks... For Now
Retail sales beat forecasts. Jobless claims dropped. And inflation, while still sticky, remains contained. Goods prices are rising, but service inflation (75% of the CPI basket) has softened. This data doesn’t scream “stagflation,” but higher tariffs could bite in Q3. For now, markets are riding the optimism, with one eye on what’s next.
🏦 The Fed: Pressure Builds, But Patience Persists
The Fed meets this week with growing pressure from the White House to cut. Yet with the ECB already 200 bps lower, Powell's team appears poised to hold steady, for now. Markets expect one to two cuts before year-end, with Jackson Hole in August likely to telegraph the pivot. We still think rate cuts + fiscal support = a powerful late-year combo for markets.
💼 Earnings Must Now Do the Heavy Lifting
Valuations are rich, with the S&P 500 trading at 22x forward earnings, the highest since 2021. That means future gains will have to come from profits. Fortunately, earnings season is off to a strong start, with 83% of companies beating estimates. This week, 40% of the S&P reports, including the heavyweights: Apple, Amazon, Meta, and Microsoft.
⚠️ Speculation Returns, But No Euphoria (Yet)
Meme stocks and short squeezes are creeping back, a potential sign of froth. But overall sentiment, as measured by the AAII survey, remains neutral. We’re watching this closely: a little speculation is fine, but the broader market needs quality earnings and stable macro signals to justify these levels.
🧮 Weekly Market Stats
Index | Close | Weekly | YTD |
|---|---|---|---|
🏛️ Dow Jones Industrial Avg. | 44,902 | +1.3% | +5.5% |
📈 S&P 500 Index | 6,389 | +1.5% | +8.6% |
💻 NASDAQ | 21,108 | +1.0% | +9.3% |
🌍 MSCI EAFE* | 2,715 | +2.8% | +20.0% |
💵 10-Yr Treasury Yield | 4.38% | 0.0% | +0.5% |
🛢️ Oil (WTI) / barrel | $65.04 | -1.5% | -9.3% |
🧾 Bonds (Agg Index) | $98.45 | +0.3% | +3.4% |
📰 Weekly In-Depth Articles
🗓️ Tuesday, July 22nd - Cash-Secured Puts: The Retiree's Secret to Monthly Income
🗓️ Thursday, July 24th - Scientists Analyzed 2.4 Million Options Trades, What They Found Changes Everything
🎓 Options 101: The First Steps to Trading
Your First Options Strategy for Steady Income
Covered calls are where many smart options traders begin, and for good reason. If you own 100 shares of stock and want to generate consistent monthly income, this simple strategy can turn idle shares into a steady paycheck.
In this week’s article, we break down:
What a covered call is (in plain English)
How to choose strike prices based on your outlook
Real-world trade examples, like using Apple stock for income
Common mistakes beginners makeand how to avoid them
A monthly covered call routine to build discipline and confidence
Whether you're sitting on long-term stock holdings or just starting your options journey, this is a foundational strategy worth mastering.
📘 Read the full guide here: Covered Calls - Your First Options Strategy for Steady Income
🧠 Mental Capital
Train not just your trading system, but your trading self.
🧠 Mental Capital - This Week’s Lesson: The Overconfidence Bias in Options Trading
The most dangerous risk in trading doesn’t come from the market. It comes after a few wins.
This week, we examine why early success in options trading often leads to overconfidence, and how it systematically erodes the risk management discipline that built those profits in the first place.
Inside this edition of Mental Capital, we break down:
✔️ The neuroscience of trading success (and why dopamine, testosterone, and cortisol conspire to ruin your discipline)
✔️ The five phases of the Overconfidence Death Spiral—and how most retail traders never make it back
✔️ Metrics pros use to detect creeping overconfidence before it leads to outsized losses
✔️ The Dunning-Kruger effect in options—and how complexity often masquerades as competence
✔️ A professional-grade system to calibrate confidence, risk, and performance in real-time
Because the hardest lesson in options trading is this:
Confidence builds success.
Overconfidence destroys it.
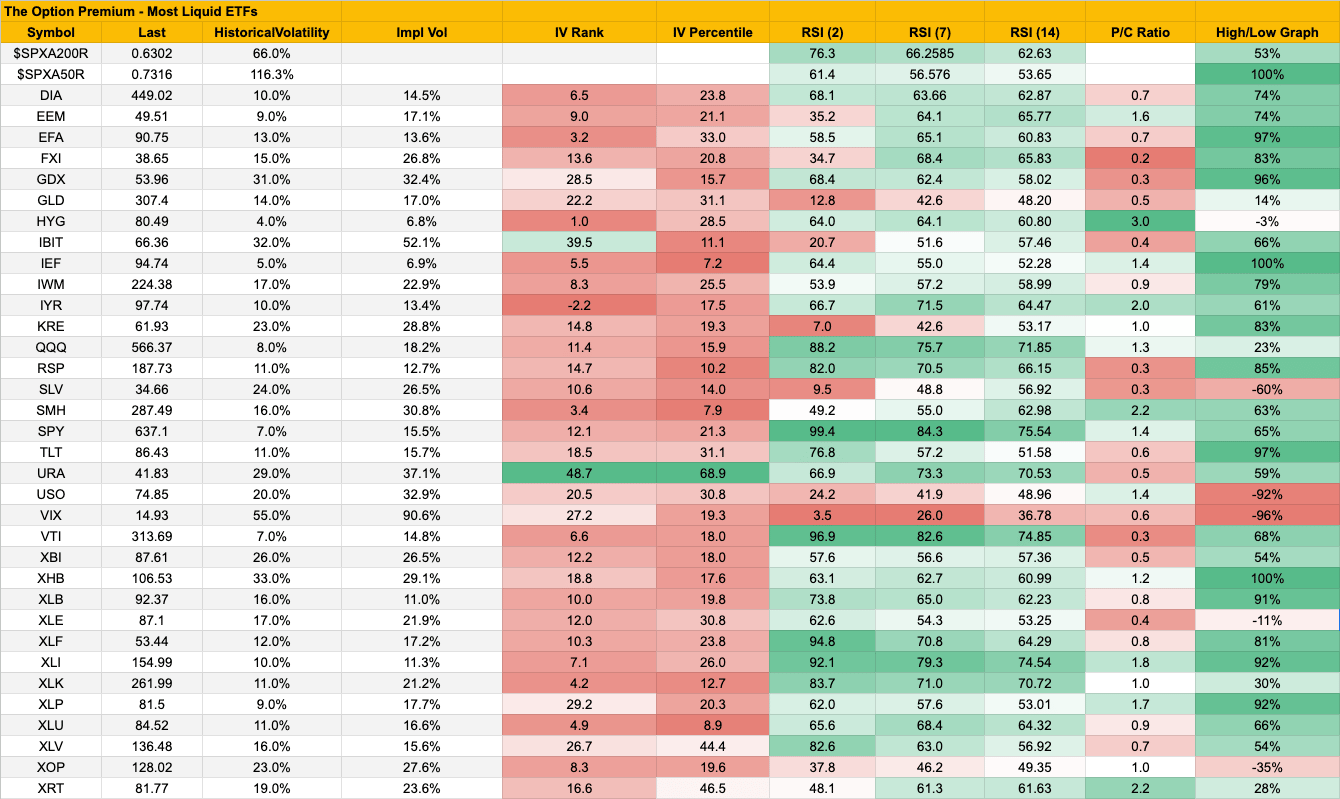
📊 The Implied Truth: Weekly Table Overview
Unlock the Full Picture – Upgrade to access the complete table, including all 100 equities (AAPL, META, AMZN, NVDA and more)
Every number tells a story. Each week, we decode the landscape across the most liquid ETFs, because this is where retail traders get the cleanest signals and the least slippage.
But the power isn’t in the data, it’s in how you interpret it.
Below is your edge: a strategic overview that reveals where the premium is overpriced, where price action is exhausted, and where the highest-probability setups exist for the coming week.
Volatility across the major indices remains muted $VIX sits at 16.41 with IV Rank under 30%. But look closer: dispersion is rising, and several sector ETFs are flashing actionable setups. This table doesn’t lie, it’s a distilled view of where opportunity and risk live.
This section is here to help you choose what works for your strategy. The numbers are facts, not opinions. Whether you sell premium, buy directional spreads, or trade reversals, the edge begins with understanding volatility and momentum. Let’s dig in.
What This Table Tells Us
Use this weekly to guide your trade ideas, not predict outcomes.
The data is factual. There’s no opinion in this grid, only opportunity.
Choose what aligns with your timeframe, risk appetite, and edge.
Week Ending July 25, 2025
The current market landscape, viewed through the lens of implied volatility, RSI patterns, and put/call ratios across major ETFs, reveals a potentially overbought but not yet unstable environment.
Broad market proxies like SPY, QQQ, and VTI are showing extreme short-term RSI readings (RSI-2 values near or above 95), signaling that equities have surged rapidly and may be due for near-term cooling. However, the implied volatility levels across these tickers remain contained, with IV Rank readings mostly below 25, suggesting that traders aren't pricing in significant risk, yet.
This combination often reflects complacency, particularly when paired with rising price action and neutral-to-bullish put/call ratios (SPY at 1.4, QQQ at 1.3), a sign that traders aren't aggressively hedging despite stretched momentum.
Under the surface, volatility is hiding in plain sight. Sector and thematic ETFs like URA (IV Rank 48.7), IBIT (39.5), and XLP (29.2) stand out as pockets where implied volatility remains elevated relative to history, even as their RSI levels signal strength. Defensive sectors such as utilities (XLU), healthcare (XLV), and consumer staples (XLP) are showing more balanced RSI levels, suggesting less speculative chasing in these areas.
Meanwhile, gold (GLD) and silver (SLV) have quietly retraced, with low RSI and rising IV, a pattern that could favor contrarian premium sellers. Add in the VIX at sub-15 with a 90% implied volatility reading and a 27.2 IV Rank, and you get a market pricing in stability, just as structural indicators begin flashing caution. The setup favors select premium-selling opportunities in high-IV, less extended names, while urging restraint on overbought broad market exposure.
1. 🟡 URA – Short Put or PMCC Setup (Uranium ETF)
IV Rank: 48.7 (very elevated)
RSI (2/7/14): 66.9 / 73.3 / 70.5 (strong but not extreme)
IV Percentile: 68.9
Implied Volatility: 37.1%
URA is exhibiting the rare combination of high implied volatility, elevated IV rank, and strong but not overbought RSI readings. This suggests premium is rich and there’s still room before the ETF becomes technically overextended. Selling out-of-the-money cash-secured puts or initiating a Poor Man’s Covered Call (deep ITM LEAPS + short-term OTM calls) could offer excellent income with favorable risk/reward. A 21–45 DTE structure would take advantage of elevated volatility while giving time for any pullbacks to normalize.
2. 🟠 IBIT – High-IV Put Spread or PMCC Candidate (Bitcoin ETF)
IV Rank: 39.5
Implied Volatility: 52.1%
RSI (2/7/14): 20.7 / 51.6 / 57.46
IV Percentile: 11.1
P/C Ratio: 0.4
IBIT is one of the few assets showing extremely high implied volatility paired with a very oversold short-term RSI (2), signaling potential reversion. With the volatility edge and modest put/call ratio, selling defined-risk premium strategies such as short put spreads or a high-IV Poor Man’s Covered Call could be timely. The IV crush from any bounce in bitcoin-related sentiment could rapidly benefit a position opened now, especially over the next 2–4 weeks.
Quick Reference: The Implied Truth Table
Field | Meaning |
|---|---|
P/C Ratio | Put/Call ratio: >1 = bearish skew, <1 = bullish bias, extremes may signal contrarian trades |
Impl Vol | Implied Volatility: higher IV = richer premiums, more expected movement |
IV Rank | IV vs. past year’s range (0–100%), >35% often favors premium-selling |
IV Percentile | % of time IV has been below current level, helps confirm if volatility is elevated |
RSI (2/7/14) | Momentum reading: >80 = overbought, <20 = oversold, shorter RSIs react faster |
📚 Educational Corner: Options Deep Dive
📚 Educational Corner: The Danger of Chasing Volatility
Why Timing Matters More Than Strategy in Options Selling
This week, we break down a critical but often overlooked truth in premium-selling: strategy means little without timing. High implied volatility (IV) may look attractive on the surface, more premium, bigger payouts, but chasing it blindly often leads traders straight into poor setups.
In this article, you’ll learn:
Why a high IV Rank isn’t a green light by itself
How selling into expanding volatility can work against you
Why professionals wait for stabilization, not spikes
How to combine IV metrics with RSI and breadth to time entries
The structural mistakes most traders make during volatility surges
A smarter, three-lens framework for managing timing, risk, and premium
If you're selling options without considering volatility timing, you're not just giving up edge, you're inviting unnecessary risk. This piece will help you think beyond the strategy and into real-world execution where edge lives.
👉 Read the full article here: The Danger of Chasing Volatility - Why Timing Matters More Than Strategy in Options Selling
🔗 Let’s Stay Connected
Have questions, feedback, or just want to say hello? I’d love to hear from you.
📩 Email me anytime at [email protected]
Thanks again for reading. I hope you found today’s insights valuable and worth your time.
Trade Smart. Trade Thoughtfully.
Andy Crowder
Founder | Editor-in-Chief | Chief Options Strategist
The Option Premium
Reply