- The Option Premium
- Posts
- Probability of Touch vs. Probability of Expiring ITM: Why Your Short Strike Gets Tested More Often Than You Think
Probability of Touch vs. Probability of Expiring ITM: Why Your Short Strike Gets Tested More Often Than You Think
Your platform shows 85% probability of profit. But there's a 30% chance the stock visits your short strike before expiration. Learn the 2:1 rule, how Prob Touch differs from Prob ITM and Prob OTM, and why closing at 50% eliminates remaining touch risk.

Andrew Crowder
April 11, 2026

Probability of Touch vs. Probability of Expiring ITM: Why Your Short Strike Gets Tested More Often Than You Think
You sell a bull put spread on SPY with a short strike at the 0.15 delta. Your platform shows an 85% probability of expiring out of the money. That feels comfortable. You place the trade, set your management rules, and move on to the next position.
Three days later, SPY drops 2.8% and your short strike is being tested. The spread is underwater. Your profit target is irrelevant because the position is now at a loss. And the question that hits every premium seller at some point arrives: "How is this possible? The probability was 85%."
The answer is that probability of expiring ITM and probability of touch are two fundamentally different measurements. The 85% number on your screen tells you the chance that the stock finishes beyond your strike at expiration. It says nothing about what happens between now and expiration. And what happens between now and expiration is where the actual experience of managing a credit spread lives.
Understanding the distinction between these probabilities, and the third metric that most traders overlook entirely, is what separates traders who panic during normal drawdowns from traders who manage through them with discipline. This article covers all three, what they mean in practical terms, and how they should change the way you think about every trade you place.
Probability of Expiring ITM: The Number on Your Screen
When you pull up an options chain and see "Prob ITM" or "Prob OTM" next to a strike price, you're looking at the probability of expiring in-the-money (or out-of-the-money). This is the metric most platforms display by default, and it's the number most traders use to evaluate their trades.
What it measures. The estimated probability that the stock will be beyond your strike price at the moment of expiration. A 0.15 delta put has approximately a 15% probability of expiring ITM, which means there's approximately an 85% probability of expiring OTM. If you sold that put (or a put spread with that short strike), the 85% is your estimated probability of profit at expiration.
How it's calculated. The number is derived from the options pricing model (Black-Scholes or a variant), using current implied volatility, time to expiration, the stock price, and the strike price. Delta serves as a rough proxy: the absolute value of delta on an option approximates its probability of expiring ITM. A 0.15 delta put has roughly a 15% chance of finishing in the money.
What it assumes. The calculation assumes the stock follows a log-normal distribution of returns, that implied volatility remains constant, and that the stock price evolves continuously without gaps. None of these assumptions are perfectly true in the real world, but they're close enough to be useful as a framework.
The critical limitation. Probability of expiring ITM is a snapshot of where the stock is expected to be at one specific moment in time: expiration. It tells you nothing about the path the stock takes to get there. A stock can visit your short strike three times during the life of the trade, cause your spread to show an unrealized loss of $500, and still expire comfortably out of the money. The final outcome was "win." The experience along the way was painful.
This is where probability of touch enters the picture.
Probability of Touch: The Number You Don't See (But Should)
Probability of touch measures the likelihood that the stock will reach your strike price at any point during the life of the option, not just at expiration. It answers a different and more visceral question: "What are the odds that my short strike will be tested before this trade is over?"
The relationship is roughly 2:1. Academic and practitioner research has established a useful rule of thumb: the probability of touching a strike is approximately twice the probability of expiring ITM at that strike. If your short put has a 15% probability of expiring ITM, the probability that the stock will touch that strike at some point before expiration is approximately 30%.
Let that sit for a moment. You sold a spread with an "85% probability of profit." But there's a 30% chance your short strike will be touched during the life of the trade. That's not a small number. Over the course of 10 trades at the same delta, you should expect 3 of those trades to see the stock visit your short strike at some point, even though 8 or 9 of them will ultimately expire profitably.
Why the 2:1 relationship exists. The stock price doesn't travel in a straight line from today to expiration. It wanders. It overshoots. It mean-reverts. During a 45-day trade, SPY might visit dozens of price levels that are nowhere near where it ultimately closes on expiration day. The expected move at expiration represents where the stock is likely to end up. But the intraday and intraweek path can carry the stock well beyond that range temporarily.
Think of it like driving from New York to Boston. The destination (expiration) is 215 miles northeast. But the actual path involves highway curves, detours, rest stops, and a wrong turn in Connecticut. The car visits locations far from the direct line even though it arrives at the correct destination. The probability of expiring ITM measures whether you arrive in Boston. The probability of touch measures whether you pass through Hartford along the way.
Why this matters for your P&L and your psychology. When the stock touches your short strike, your credit spread is at or near its maximum loss on paper. Even if the stock subsequently reverses and the trade ends profitably, you experienced the full weight of that unrealized loss. Your stop-loss rules are triggered. Your emotions spike. Your confidence in the trade, and possibly the entire strategy, takes a hit.
If you don't know that a 30% touch rate is completely normal for a 0.15 delta spread, you'll interpret the drawdown as evidence that something went wrong. You'll start second-guessing your delta selection, your entry timing, your underlying choice. But nothing went wrong. The stock did exactly what random price paths do: it wandered through a range that temporarily included your strike before ultimately closing elsewhere.
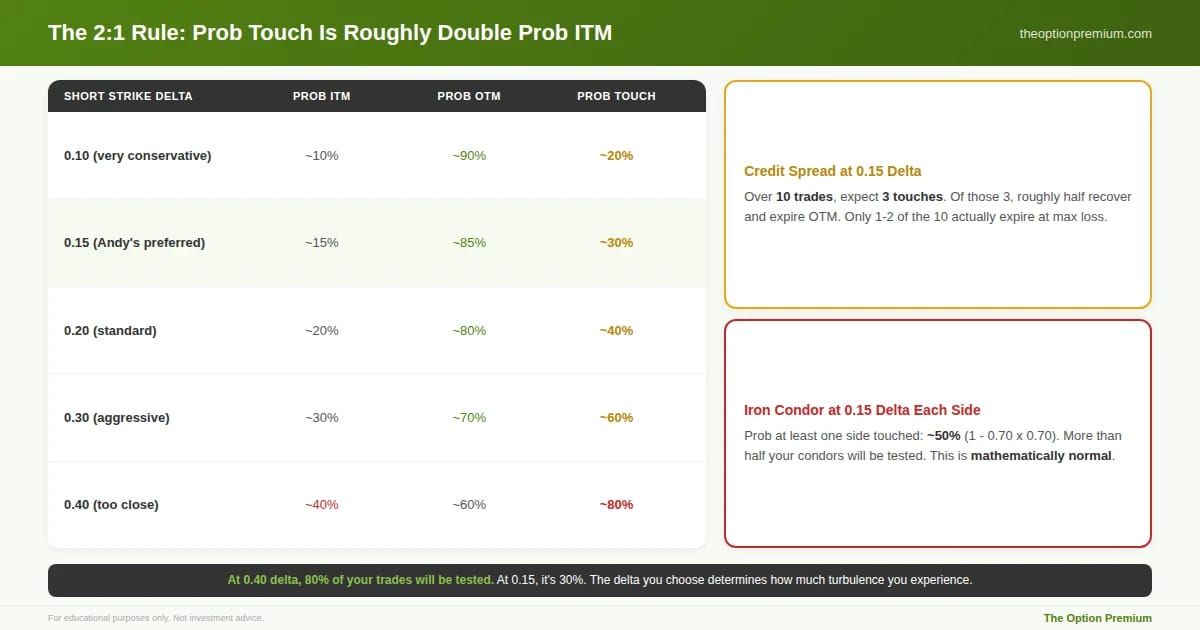
The 2:1 rule across different delta levels. At 0.15 delta (the preferred range), Prob ITM is approximately 15%, Prob OTM is 85%, and Prob Touch is roughly 30%. Over 10 trades at this delta, expect 3 touches, but only 1-2 actual expirations at max loss. At 0.40 delta, 80% of trades will be tested during their life. Iron condors compound the probability: with 0.15 delta on both sides, the chance that at least one side gets touched is approximately 50% (1 minus 0.70 times 0.70). More than half your condors will be tested. This is mathematically normal.
Probability OTM: The Number You're Actually Trading
Probability of expiring out-of-the-money is simply the inverse of probability of expiring ITM. If Prob ITM is 15%, then Prob OTM is 85%. This is the metric premium sellers care about most because it represents the probability that the trade expires profitably (or at least doesn't expire at max loss).
Prob OTM is your probability of full profit at expiration. If you sold a $5 wide bull put spread for $1.00 credit and the short strike has a 15% Prob ITM, your Prob OTM of 85% means there's an 85% chance you keep the full $1.00 credit at expiration (minus the cost to close, if you close early). Your breakeven is actually further away than the short strike (short strike minus credit received), so the probability of profit is slightly higher than Prob OTM suggests, but Prob OTM is the standard reference point.
How I use Prob OTM in practice. Every trade I enter has a short strike in the 0.15 to 0.20 delta range, which translates to an 80-85% Prob OTM. This is the probability zone where I've found the best balance between premium collected and win rate over 24 years. Going further OTM (0.10 delta, 90% Prob OTM) collects too little premium to justify the capital commitment. Going closer to the money (0.30 delta, 70% Prob OTM) increases the premium but decreases the win rate enough that the Law of Large Numbers takes longer to assert itself.
The 80-85% zone is the sweet spot. But it comes with a probability of touch of 30-40%. You have to be ready for that.
The Three Probabilities in Practice: A Real Trade
SPY at $560. You sell the $540/$535 bull put spread with 45 DTE for $0.85 credit. The $540 short strike has a delta of 0.16.
Probability of expiring ITM: approximately 16%. There's a 16% chance SPY closes below $540 at expiration. This is the risk of max loss.
Probability of expiring OTM: approximately 84%. There's an 84% chance SPY closes above $540 at expiration. This is your probability of keeping the full credit (if held to expiration).
Probability of touch: approximately 32%. There's a 32% chance SPY will trade at or below $540 at some point during the next 45 days, even if it ultimately closes above $540 at expiration.
Now here's the key insight. Approximately 1 in 3 of your 0.16 delta trades will see the stock touch your short strike during the life of the trade. But only about 1 in 6 will actually expire ITM. That means roughly half the trades that touch your short strike will ultimately recover and expire profitably. The touch was scary. The touch triggered unrealized losses. But the touch did not mean the trade was a loser.
This is why your management rules matter more than your entry. The 50% profit target, the 2-2.5x credit stop loss, the 21 DTE review, and the 10 DTE hard exit all exist to navigate the gap between probability of touch and probability of expiring. Without management rules, the touch becomes an emotional crisis. With them, it's a data point that triggers a pre-planned decision.
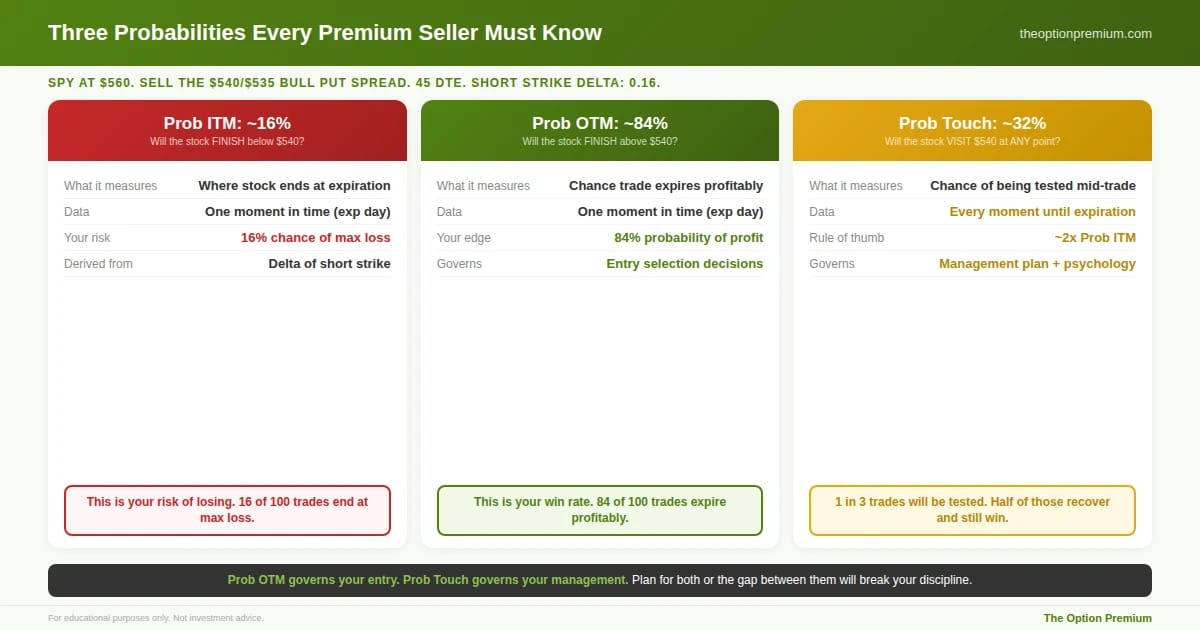
Three probabilities every premium seller must understand, shown for a real SPY $540/$535 bull put spread at 0.16 delta with 45 DTE. Prob ITM (~16%) measures the chance the stock finishes below your strike at expiration, representing your risk of max loss. Prob OTM (~84%) is the inverse and represents your probability of profit, governing entry selection. Prob Touch (~32%) measures the chance the stock visits your strike at any point during the trade, roughly 2x Prob ITM. One in three trades will be tested even though five in six expire profitably. Roughly half of all touches recover. Prob OTM governs your entry. Prob Touch governs your management plan and emotional expectations.
How This Changes the Way You Should Think About Every Trade
Expect drawdowns, don't fear them. If you run 10 credit spreads per month at 0.15 delta, 3 of them will likely be touched at some point. This is not a failure of the strategy. It's the strategy working exactly as the math predicts. The traders who survive and compound are the ones who planned for the 30% touch rate before they entered the trade, not the ones who panic when it happens.
Your stop loss exists for the touch, not just for expiration. The 2-2.5x credit stop loss is specifically designed for the scenario where the stock touches your short strike. When the spread reaches 2x your original credit, that's often the point where the stock is at or near your short strike. The stop loss converts a touch event into a controlled, pre-planned exit. Without it, you're making a real-time decision under maximum emotional pressure.
Probability of touch explains why closing at 50% profit is so powerful. If you close the trade when you've captured 50% of max profit, you've typically exited the position 15-20 days before expiration. During those remaining days, the probability of touch would have continued to accumulate. By closing early, you remove yourself from the path risk entirely. You captured your profit and eliminated the remaining 15-20 days of potential touch events. This is why the annualized return of closing at 50% often exceeds holding to full expiration, even though you're collecting less per trade. You're making more per unit of time at risk.

Why closing at 50% of max profit is about more than locking in gains. When you close early (typically 15-25 days into a 45-day trade), you eliminate the remaining 15-20 days of accumulated touch probability and gamma risk entirely. The trade that was 32% likely to be touched over its full life now has zero remaining touch risk because it no longer exists. Your capital is freed for the next trade. The annualized return on capital is often higher because you're earning less per trade but spending far less time per dollar earned. Less per trade. More per year. Zero remaining path risk.
Wider spreads don't change the touch probability. If you widen your spread from $5 to $10, the probability of touch on your short strike doesn't change. You've only moved the long strike further away, which increases your max loss but doesn't affect how often the stock reaches the short strike. The short strike's delta, and therefore its approximate Prob ITM and Prob Touch, is the same regardless of spread width. Width changes risk-reward. It doesn't change the probability of being tested.
Iron condors compound the touch probability. If you sell an iron condor with both a put spread and a call spread, each with 0.15 delta short strikes, the probability that at least one side gets touched is not 30%. It's closer to 50% (roughly 1 minus the probability that neither side gets touched: 1 - 0.70 x 0.70 = 0.51). Over half your iron condors will see at least one side tested during the life of the trade. This is completely normal. The question isn't whether you'll be tested. It's whether your management plan is ready for it.
The Practitioner Edge: How I Use All Three Probabilities
Entry selection: Prob OTM of 80-85%. This is the 0.15 to 0.20 delta range. It provides the best trade-off between premium collected and long-term win rate. I never enter a trade without checking this number.
Mental preparation: Prob Touch of 30-40%. Before every trade, I acknowledge that there's a 1 in 3 chance the stock will visit my short strike during the life of the position. This isn't pessimism. It's calibration. When it happens, it's not a surprise. It's the scenario I planned for.
Management triggers: tied to Prob ITM changes. As the stock moves and time passes, the Prob ITM on my short strike changes in real time. If Prob ITM rises from 16% to 35-40%, my position is being seriously tested. That's when the management playbook kicks in: review the stop loss, check if the move is temporary or sustained, and decide whether to hold, adjust, or close based on the pre-written plan.
Position sizing: built for the touch, not just the expiration. I size every position assuming that the touch scenario is possible. That means my max loss on any single trade is 2-5% of my account. If the touch triggers my stop loss at 2x credit, the actual loss is the 2x credit (about 40% of the spread width on a 1/3 credit spread). On a $5 wide spread with $1.65 credit, a 2x stop means buying back at $3.30, for a $1.65 loss per spread. That's defined, planned, and manageable. The touch happened. The management plan handled it. The account survives to take the next trade.
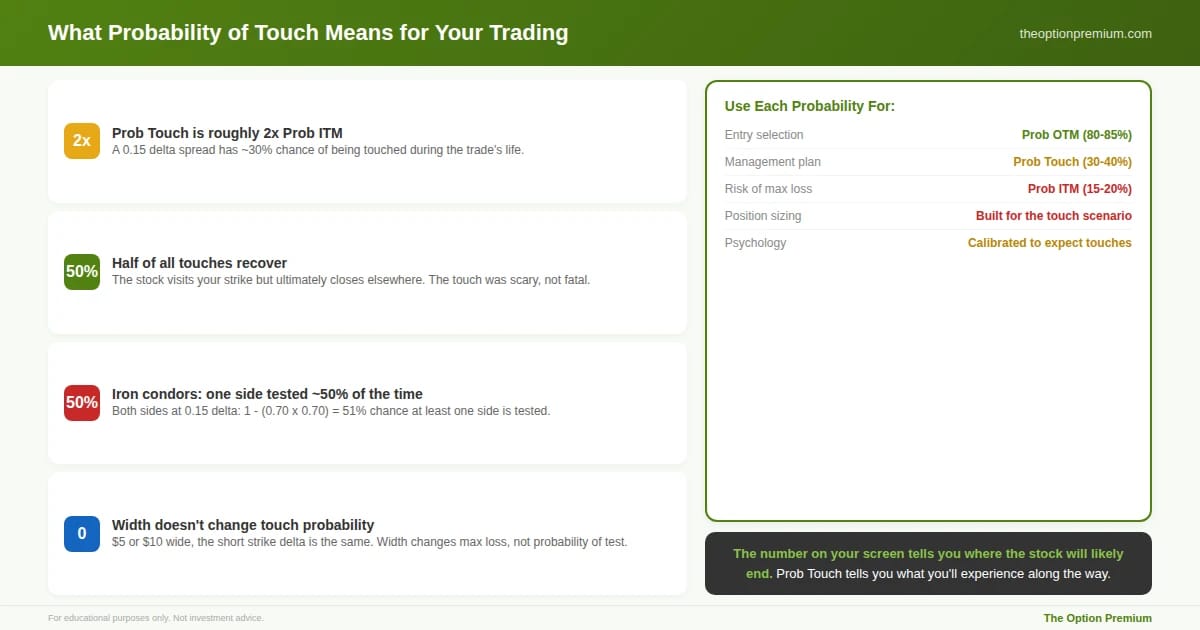
The practical framework for using all three probabilities. Prob Touch is roughly 2x Prob ITM. Half of all touches recover and expire profitably. Iron condors at 0.15 delta each side have approximately 50% chance of at least one side being tested. Spread width changes max loss but does not change touch probability. Use Prob OTM (80-85%) for entry selection. Use Prob Touch (30-40%) for management planning and emotional calibration. Use Prob ITM (15-20%) for understanding risk of max loss. Size every position assuming the touch scenario is possible.
Risk Reality Check
The 2:1 rule of thumb (Prob Touch approximately equals 2x Prob ITM) is a useful approximation, not an exact law. The actual relationship depends on the stock's volatility, whether the stock trends or mean-reverts during the period, and the time to expiration. In high-volatility environments, the touch probability can exceed 2x Prob ITM because the stock is making wider swings. In low-volatility, grinding environments, it can be somewhat lower.
The approximation is also based on continuous price movement. In reality, stocks gap (especially overnight and around events). A stock can go from "nowhere near my strike" to "through my strike" without ever technically touching the strike during regular market hours. Gaps mean the effective touch probability on event-driven trades (earnings, FDA announcements, geopolitical shocks) is higher than the theoretical calculation suggests.
None of this invalidates the framework. It reinforces why probability of touch is the metric that should govern your management plan and your emotional expectations, while probability of expiring OTM governs your entry selection. They serve different purposes. Using the right metric for the right decision is what separates professionals from amateurs.
Key Takeaways

Probability of expiring ITM measures the chance the stock finishes beyond your strike at expiration. It's the number on your options chain and the basis for your win rate. At a 0.15 delta short strike, Prob ITM is approximately 15% and Prob OTM is approximately 85%. This is the metric that governs entry selection.
Probability of touch measures the chance the stock reaches your strike at any point during the trade's life. The rule of thumb: Prob Touch is approximately 2x Prob ITM. A 0.15 delta spread has about a 30% chance of being touched. Over 10 trades, expect 3 to be tested, even though 8-9 will ultimately expire profitably. This is the metric that governs your management plan and emotional expectations.
Roughly half of all touches recover. The stock visits your short strike but ultimately closes elsewhere by expiration. This is why panic-closing at the first sign of a drawdown systematically reduces your long-term win rate. The management rules (50% profit target, 2-2.5x stop, 21 DTE review, 10 DTE exit) exist specifically to navigate the gap between touch and expiration.
Closing at 50% profit eliminates the remaining touch risk. Once you've captured half the premium and closed the trade, the accumulated probability of touch over the remaining days becomes irrelevant. This is a primary reason why closing early produces higher annualized returns than holding to full expiration.
Iron condors compound the touch probability. With 0.15 delta on both sides, the probability of at least one side being touched is approximately 50%, not 30%. More than half your iron condors will be tested during the trade. This is mathematically normal. Your management plan, not your entry, is what determines whether you profit through these tests.
The probability on your screen tells you where the stock will likely be at the end. The probability of touch tells you what you'll experience along the way. Professional premium sellers plan for both. They enter based on expiration probabilities and manage based on touch probabilities. The traders who only look at one number are always surprised by the other.
Andy Crowder
📩 Want to see how a 24+ year professional options trader approaches the market?
Subscribe to The Option Premium, my free weekly newsletter where I share:
Probability-based strategies that actually work: credit spreads, cash-secured puts, the wheel, LEAPS, poor man's covered calls, and more
Real trade breakdowns with the math behind every decision
Market insights for any environment, whether we're grinding higher, pulling back, or chopping sideways
No hype. No predictions. Just the frameworks I've used to trade options for over two decades.
📺 Want more? Follow me on YouTube for in-depth tutorials, live trade analysis, and the kind of education you won't find anywhere else.
Connect with me:
This newsletter is for educational purposes only and should not be considered investment advice. Options trading involves significant risk and is not suitable for all investors. Past performance does not guarantee future results. Always consult with a qualified financial professional before making investment decisions.
Reply