- The Option Premium
- Posts
- PMCC - Expected Move for Picking Short Calls
PMCC - Expected Move for Picking Short Calls
Use expected move to choose short-call strikes that pay and protect.
Expected Move for Picking Short Calls
Most traders pick their short call strikes by gut feel.
"That looks far enough away."
"This one pays better."
"I'll just go two strikes out."
That's gambling, not trading.
The professionals I know, the ones who've been collecting premium for decades, use expected move. It's a statistical boundary that tells you how far the market thinks a stock will move before your option expires.
Not a guarantee. Not a prophecy. Just probability.
And when you’re selling calls against your LEAPS, probability is the only edge you’ve got.
Let me show you how to use it.
What Expected Move Actually Tells You
Expected move is the one standard deviation price range implied by current option prices.
Strip away the math, and here's what matters: there's roughly a 68% probability the stock will stay within that range by expiration.
Flip it around: there's a 32% chance the stock moves beyond that range, 16% it goes higher, 16% it goes lower.
For PMCC traders selling calls, you care about that upper bound.
If ABC stock is trading at $500 and the expected move is $15, the market is saying there's about a 16% chance ABC closes above $515 at expiration.
That $515 level? That's your reference point for picking strikes.
Why This Matters for Short Calls
When you sell a call, you're betting the stock stays below your strike.
The further out you go, the safer you are, but the less premium you collect. The closer in you go, the more premium you get, but the higher your risk of getting tested or going ITM.
Expected move gives you a rational way to calibrate that trade-off.
Here's the framework:
Sell at or near the upper expected move (1 standard deviation): Higher premium, moderate risk, about 16% chance of trouble
Sell beyond the upper expected move (1.5-2 standard deviations): Lower premium, lower risk, about 2 to 7% chance of trouble
Sell below the upper expected move: Highest premium, highest risk, not recommended for PMCCs
Most consistent PMCC operators I know aim for strikes at or slightly beyond the one standard deviation mark. You're collecting meaningful premium while staying on the right side of probability.
How to Calculate Expected Move
You don't need a PhD in statistics. You need two numbers from your options chain.
The formula:
Expected Move = (ATM Call Price + ATM Put Price) × 0.85
The 0.85 adjustment accounts for the fact that at-the-money (ATM) options slightly overstate movement compared to what standard deviation predicts.
Example:
SPY is at $673. The 45-day options show:
$673 call: $18.50
$673 put: $17.00
Sum: $35.50
Expected move: $35.50 × 0.85 = $30.18
The market expects SPY to stay between $642.82 and $703.18 over the next 45 days about 68% of the time.
For your short call, you'd look at strikes around $703 (at the boundary) or $708-713 (beyond it).

Expected move formula (ATM call plus ATM put times 0.85) with full SPY worked example: $673 price, $30.18 move, $642.82 to $703.18 range.
Most Platforms Show This Already
You don't actually need to calculate this manually.
Most major brokers display expected move right on the options chain:
Thinkorswim: Displayed at the top of the chain as "Prob. ITM"
Tastyworks: Shows expected move ranges with visual markers
Interactive Brokers: Lists standard deviation move in the chain header
Robinhood: Shows "% chance of profit" based on expected move
If your platform doesn't show it, you can calculate it in 10 seconds. But chances are, it's already there, you just haven't been looking at it.
Applying It to Strike Selection
Let's walk through a real decision process.
Setup:
You own SPY LEAPS: Jan 2026 $610 call
SPY current price: $673
Your LEAPS cost basis: $80
Looking to sell a 45-day call
Step 1: Get the expected move
From the options chain:
$673 call: $18.00
$673 put: $16.50
Expected move: ($18 + $16.50) × 0.85 = $29.33
Upper boundary: $673 + $29.33 = $702.33
Step 2: Identify your strike candidates
Looking at calls around and above $702.33:
$695 call: $10.50 (below expected move, risky)
$703 call: $7.50 (at expected move, balanced)
$710 call: $5.00 (beyond expected move, conservative)
$720 call: $3.00 (well beyond, very conservative)
Step 3: Pick based on your priorities
If you want maximum income and accept moderate risk: Sell the $703 call for $7.50. You're at the statistical boundary, 16% chance of getting tested.
If you want good income with more safety: Sell the $710 call for $5.00. You've given yourself about $7 buffer beyond expected move, roughly 10% chance of getting tested.
If you're prioritizing protection over income: Sell the $720 call for $3.00. You're about $17 beyond expected move, about 5% chance of getting tested.
There's no single right answer. It depends on your risk tolerance, market conditions, and how aggressive you want to be.
But now you're making an informed decision based on probability, not just picking a strike that "feels" right.
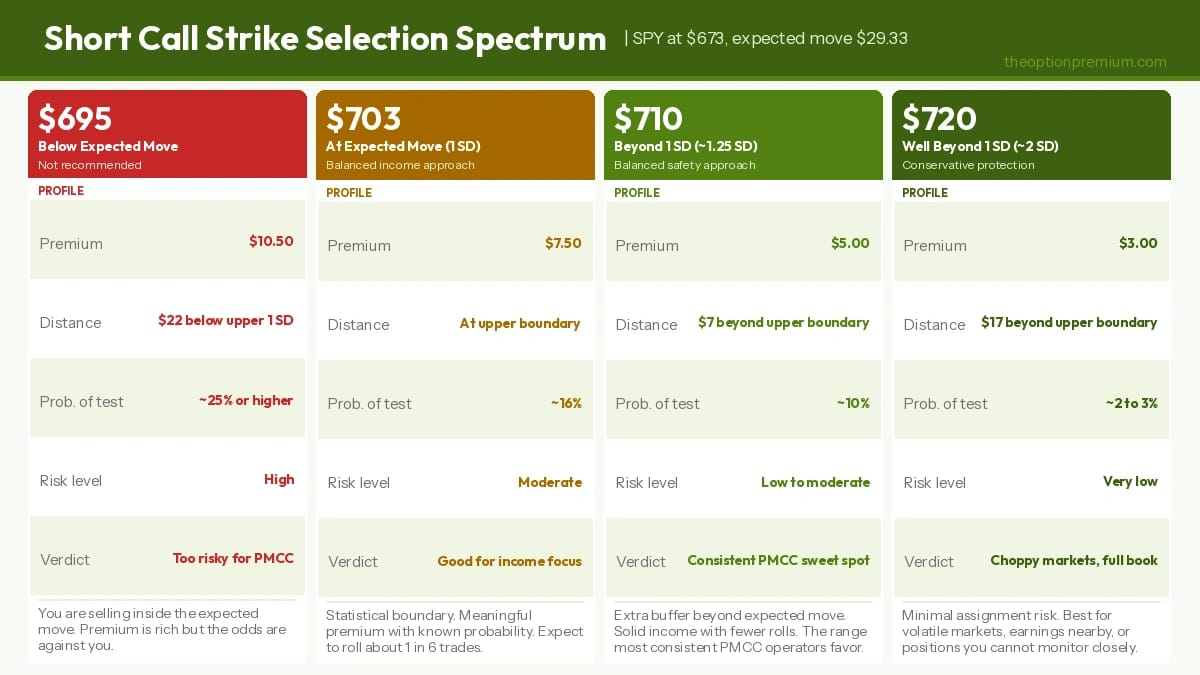
Short call strike spectrum for SPY at $673: $695 too risky, $703 at 1 SD, $710 PMCC sweet spot, $720 conservative with probability at each level.
Adjusting for Market Conditions
Expected move isn’t static. It changes based on implied volatility.
High volatility environment (VIX > 20):
Expected moves expand. A stock that normally has a $15 expected move might show $25. Your strikes need to adjust accordingly, go further out to maintain the same probability of success.
Low volatility environment (VIX < 15):
Expected moves contract. That same stock might only show a $10 expected move. You can sell closer strikes and still maintain reasonable probability.
The key insight:
Always calculate expected move fresh for each trade. Don't assume "I usually sell 2 strikes out" will work in all volatility regimes.
The market's expectations change. Your strike selection should change with them.
Real-World Example: NVDA During Volatility Spike
Let's look at how this plays out when conditions shift.
Scenario 1: Normal volatility
NVDA: $189
Expected move (45 days): $15
Upper boundary: $204
Reasonable short call strikes: $205-$215
Premium at $205: $4.50
Scenario 2: High volatility (earnings week)
NVDA: $189
Expected move (45 days): $28 (implied volatility spiked)
Upper boundary: $217
Reasonable short call strikes: $220-$230
Premium at $220: $7.00
Same stock, same price, wildly different expected moves.
If you blindly sold the $205 strike during the high volatility period just because "that's what I usually do," you'd be selling a strike that's now well inside the expected move, significantly higher risk than you think you're taking.
Expected move keeps you calibrated to current market expectations, not historical patterns.
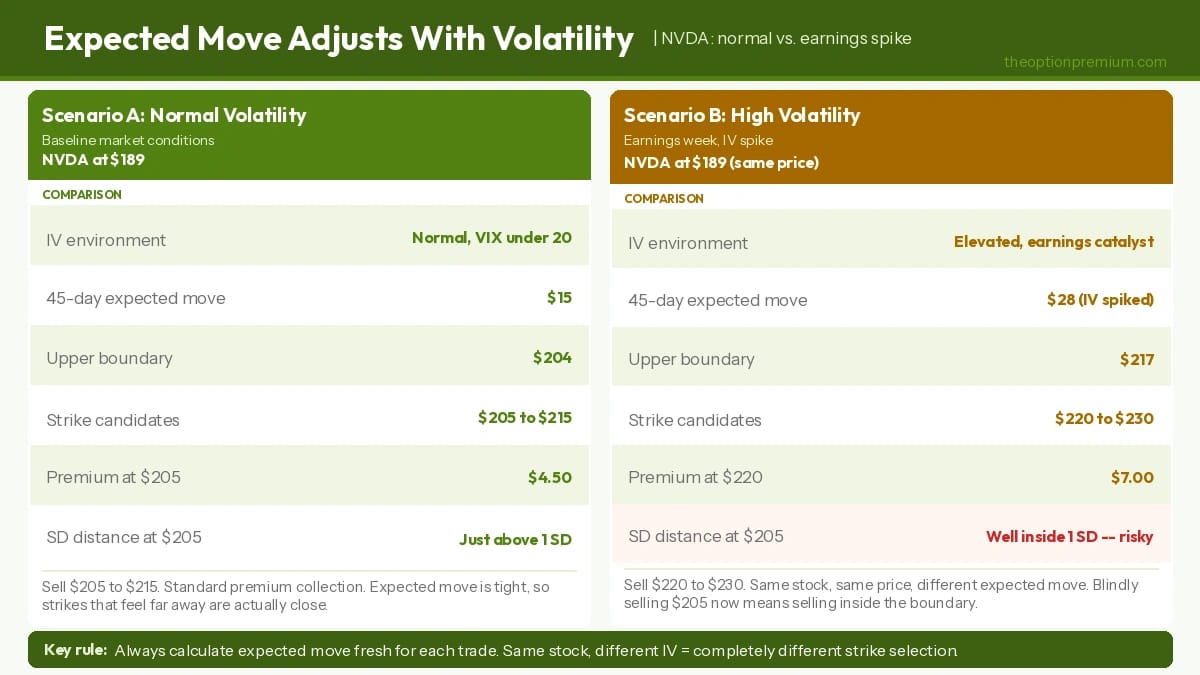
Expected move volatility adjustment NVDA example: normal conditions $15 expected move vs. earnings week $28 expected move at same $189 price.
Here's the uncomfortable truth: there's no free lunch.
You can't collect $8 in premium with a 2% chance of getting burned. Higher premium always means higher probability of the strike getting tested.
What expected move does:
It shows you the exchange rate between premium and risk so you can make conscious choices.
Common strike strategies:
At expected move (1 SD):
Premium: High
Probability of trouble: ~16%
Best for: Traders comfortable with occasional rolls, prioritizing income
1.5 standard deviations out:
Premium: Medium
Probability of trouble: ~7%
Best for: Balanced approach, moderate risk tolerance
2 standard deviations out:
Premium: Low to medium
Probability of trouble: ~2-3%
Best for: Conservative traders, choppy markets, positions you don't want to babysit
I generally operate between 1.0 and 1.5 standard deviations. That gives me meaningful premium while keeping probability on my side.
But during earnings season, uncertain macro environments, or when I'm already running a full book? I'll go to 1.5 to 2 standard deviations and accept less premium for better risk control.
The point is: I'm making that choice consciously, based on quantified probability.
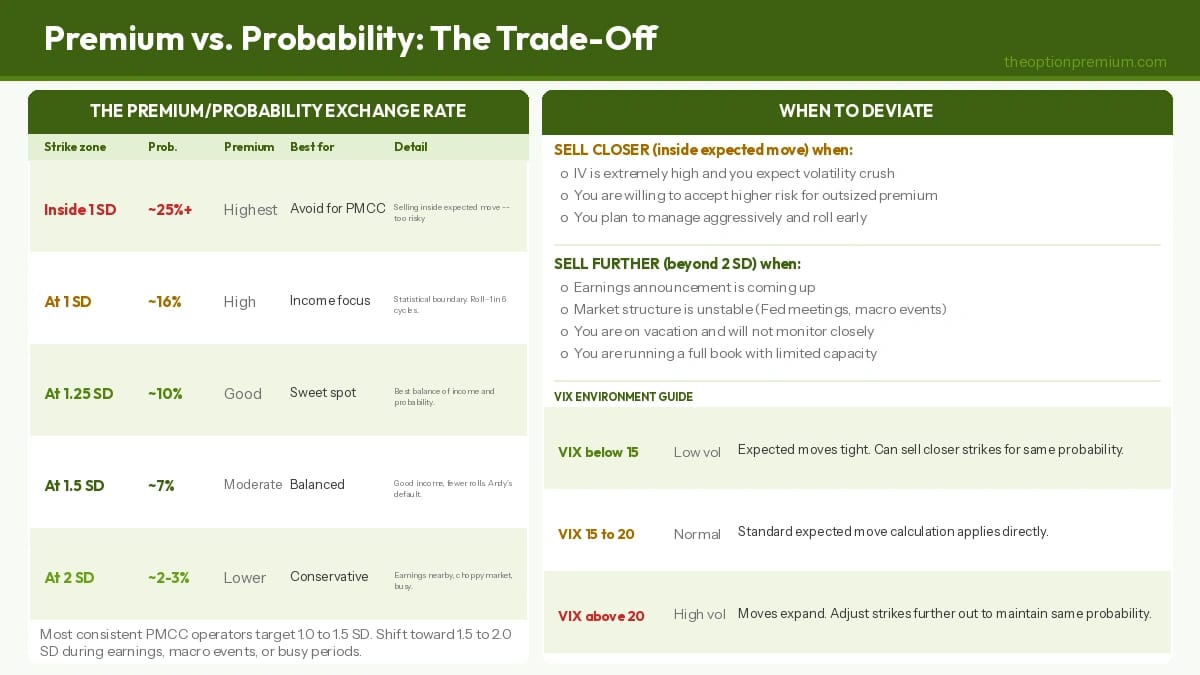
Expected move premium vs. probability tradeoff table: inside 1 SD to 2 SD with probability tested, premium level, and when to deviate guidance.
What Expected Move Doesn't Tell You
Let's be clear about the limitations.
Expected move is not:
A prediction of what will happen
A guarantee the stock stays within the range
An accounting for tail risk events (earnings surprises, black swans, etc.)
A substitute for position sizing and risk management
It's a probability distribution based on current option pricing. That pricing reflects what the market thinks might happen, not what will happen.
Stocks exceed expected move all the time. That's the 32% probability at work.
But over many trades, using expected move to guide your strike selection means you're consistently positioning yourself where probability favors you.
That's the best you can do. Options trading is a probability game. Play it like one.
Combining Expected Move with Technical Levels
Here's where it gets practical.
Expected move gives you a statistical boundary. Technical analysis gives you concrete price levels. Use both.
Example:
AAPL trading at $270
Expected move: $15
Upper boundary: $285
But there's resistance at $280 from the previous high
You've got two options:
Sell the $285 call (at expected move): Collect more premium, but you're above a technical resistance level that might act as a magnet
Sell the $280 call (slightly below expected move): Collect slightly less, but you're using a technical level as additional protection
I'll usually favor the technical level if it's close. Why? Because resistance levels represent real trading activity, buyers and sellers making decisions at specific prices.
Expected move is theoretical. Support and resistance are empirical.
When they align, say, the upper expected move lands right at a major resistance level, that's an ideal short strike. You've got statistical and technical factors working together.
The Weekly vs. Monthly Consideration
Expected move scales with time, but not linearly.
A 7-day expected move is much smaller than one-quarter of a 30-day expected move. That's because volatility compounds with the square root of time.
Practical impact:
If you're selling weekly calls, your expected move will be tight. Strikes that seem "far away" on a monthly basis are actually close on a weekly basis.
If you're selling 45-60 day calls (which I recommend for PMCCs), you're working with wider expected moves and more breathing room.
Example:
SPY at $673:
7-day expected move: $13
45-day expected move: $30
That's not a 6.4× multiple (45/7 days). It's about 2.3× because volatility grows with the square root of time.
For PMCC traders, this is why selling 45-60 day calls works well. You get wider expected moves, which means more room between the current price and your strike, which means better probability of the short call expiring worthless.
Building Your Selection Process
Here's how to systematically apply this to every PMCC position.
Before you sell a call:
Calculate expected move (or pull it from your platform)
Identify the upper boundary (current price + expected move)
Find strikes at and beyond that boundary (evaluate premium at each)
Check technical levels (any resistance near your candidate strikes?)
Choose based on risk tolerance (at boundary for income, beyond for safety)
Document your decision (strike selected, premium collected, probability level chosen)
This takes maybe two minutes per position. But it transforms your strike selection from guesswork into methodology.

Expected move 6-step pre-trade process with technical levels integration and platform guide for Thinkorswim, Tastyworks, IBKR, and Robinhood.
When to Deviate from the System
Rules are useful until they're not.
There are times when I'll deliberately sell inside the expected move or well beyond it, and those decisions are intentional deviations, not mistakes.
Sell closer (inside expected move) when:
Implied volatility is extremely high and you believe it will contract (volatility crush trade)
You're willing to accept higher risk for outsized premium
You're already planning to manage aggressively and expect to roll early
Sell further (beyond 2 SD) when:
Earnings announcement is coming up (tail risk is high)
Market structure is unstable (Fed meetings, geopolitical events)
You're on vacation and won't be monitoring closely
The key is: these are conscious choices, not defaults. You know what probability you're accepting and why.
Tracking Your Results
Here's what separates consistent traders from everyone else: they track their results and learn from the data.
What to record:
Expected move at time of sale
Strike selected (in dollars and as a % of expected move)
Premium collected
Outcome: expired worthless, rolled, tested, assigned
After 20-30 trades, you'll see patterns:
What percentage of your trades at 1 SD actually got tested? (Should be around 16%, but your experience may vary)
Which volatility environments were most profitable for you?
Did you make more money being aggressive or conservative?
This feedback loop is how you refine your approach. Expected move gives you the framework, but your own trading data tells you how to apply it in your specific circumstances.
The Honest Assessment
Let me be direct about what this approach delivers.
Using expected move to pick short strikes won’t eliminate losses. You’ll still have positions go against you. You’ll still need to roll. You’ll still face scenarios where the stock blows through your strike and you’re scrambling.
What it will do:
Remove arbitrary decision-making from your process
Give you consistent criteria for strike selection
Align your choices with current market expectations
Let you calibrate risk and reward consciously
That's enough.
Over 50 trades, 100 trades, 200 trades, the trader using expected move will have better risk-adjusted returns than the trader picking strikes by feel.
Not because the system is perfect. Because it's systematic.
Your Next Steps
If you're running PMCCs now, start applying expected move this week:
Pull up your current positions, check where your short strikes sit relative to expected move
For your next trade, calculate expected move before selecting a strike
Document your choice and the reasoning
Track the outcome
Repeat for 10 trades, then review your results
After 10 trades, you'll have real data on how expected move works in your hands, with your risk tolerance, in current market conditions.
That's worth more than any abstract discussion about standard deviations and probability.
The system works, but only if you use it.
Continue the Poor Man’s Covered Call series
This article is part of The Definitive Guide to Poor Man’s Covered Calls. From short-call selection, the natural next steps are:
Choosing the right LEAPS strike: the long-call side of the same decision.
Laddering your short calls for steady income: stacking expirations once your strikes are set.
When to roll your LEAPS: managing the long call as time passes.
Probabilities over predictions,
Andy
📩 Join thousands of readers building a professional foundation.
Subscribe to The Option Premium and learn to trade with confidence and clarity.
📺 Want more education and community?
🎥 Subscribe on YouTube for in-depth tutorials and live trade breakdowns.
📘 Join the conversation on Facebook for exclusive insights, discussions, and real-time updates.
Disclaimer: This is educational content only. Not investment, tax, or legal advice. Options involve risk and aren't suitable for all investors. Examples are illustrative. Real results will vary. Talk to professionals before you risk real money.
Reply