- The Option Premium
- Posts
- How Professional Options Traders Use Multi-Timeframe RSI for 30-60 DTE Vertical Credit Spreads
How Professional Options Traders Use Multi-Timeframe RSI for 30-60 DTE Vertical Credit Spreads
The 2, 5, 9, and 14-day RSI each serve a specific purpose. The professional's confluence framework for bull put and bear call spread entry timing, plus the supplementary data (IV Percentile, ATR, support/resistance) that sharpens the analysis.

Andrew Crowder
April 26, 2026
How Professional Options Traders Use Multi-Timeframe RSI for 30-60 DTE Vertical Credit Spreads
Most retail traders use RSI the way it's taught in every beginner's book: 14-period, oversold below 30, overbought above 70, and a single signal triggers a trade. That approach has two problems for premium sellers. First, the 14-day RSI is too slow and too general to capture the specific setups that produce high-probability credit spread entries. Second, any single timeframe is prone to false signals that a professional would have filtered out using confirmation from other periods.
Professional options traders who sell premium use RSI differently. They use it as a multi-timeframe confluence tool, not a single-signal oscillator. The 2, 5, 9, and 14-day readings each serve a specific purpose. When they align, the setup is high-conviction. When they diverge, the professional waits. This article covers exactly how to layer these four timeframes for 30 to 60 DTE vertical credit spreads, and what additional data sources sharpen the analysis even further.
Before going deeper, it's worth stating the premium seller's philosophical position on technical indicators. RSI does not replace the fundamental framework of IV Percentile selection, delta-based strike placement, position sizing, and the 30-60 DTE entry window. RSI is a supplementary tool that answers two specific questions: which side of the market should I sell premium on (bull put or bear call), and when within the current IV environment is the optimal entry. It does not tell you whether to trade. It tells you how to structure the trade you've already decided to make.
Why Each RSI Timeframe Matters
Each of the four periods measures momentum at a different resolution. Using only one is like trying to understand a symphony by listening only to the cello. You get part of the picture, but you miss the interplay that makes the piece coherent.
The 14-day RSI serves as your trend filter. This is the traditional period that most charting platforms default to, and it's the right tool for answering one question: what's the underlying trend of this stock or index over the past two-to-three weeks of trading? When the 14-day RSI is above 50, the stock is in a bullish intermediate trend. Below 50, bearish. This single reading biases your credit spread selection. In an uptrending stock (14-day RSI above 50, ideally above 55-60), you favor bull put spreads. In a downtrending stock (14-day RSI below 50, ideally below 40-45), you favor bear call spreads. You do not sell bull put spreads on stocks in clear downtrends. You do not sell bear calls on stocks in clear uptrends. The 14-day RSI answers this directional question reliably because it's slow enough to filter out day-to-day noise.
The 9-day RSI confirms intermediate momentum. This is the reading that should agree with the 14-day for clean setups. When both 14-day and 9-day RSI are above 50, you have a cohesive bullish bias. When they diverge, the trend is in transition, and premium-selling setups become more ambiguous. Divergences between the 9 and 14-day are an early warning that the intermediate trend may be rolling over. Professional traders pause new entries until the two timeframes re-synchronize.
The 5-day RSI identifies short-term extremes. This is where the entry timing starts to emerge. In an uptrending stock (14-day above 50), a 5-day RSI reading below 30 indicates a short-term pullback within the larger uptrend. That's the ideal condition for selling a bull put spread: the stock is temporarily oversold on the short timeframe while the longer timeframe trend remains intact. You're selling into fear that the broader trend is about to overwhelm. In a downtrending stock, a 5-day RSI above 70 signals a short-term bounce within the larger decline, the ideal setup for selling a bear call spread.
The 2-day RSI is the precision entry trigger. This is the most sensitive reading, and it's used in the style of traders like Larry Connors, who pioneered short-period RSI for mean-reversion setups. The 2-day RSI moves quickly between extremes. Readings below 10 indicate extreme short-term oversold conditions. Readings above 90 indicate extreme short-term overbought conditions. Because the 2-day RSI can produce these extreme readings in a single trading day, it serves as the timing mechanism rather than the directional tool. You don't enter on the 2-day RSI alone. You enter on the 2-day RSI confirming what the three longer timeframes have already established.
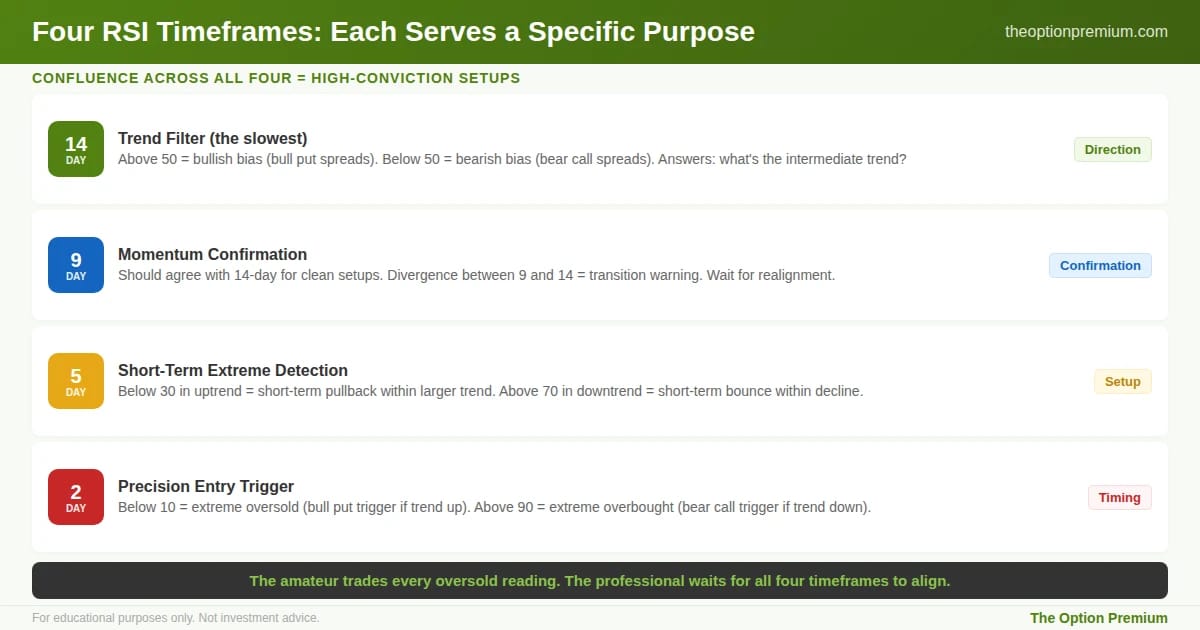
The four RSI timeframes and their specific purposes. The 14-day answers the trend question: above 50 biases toward bull put spreads, below 50 biases toward bear calls. The 9-day confirms intermediate momentum and flags transitions through divergence. The 5-day identifies short-term extremes within the larger trend (below 30 in uptrends, above 70 in downtrends). The 2-day is the precision entry trigger (below 10 or above 90 for extreme setups). The amateur trades every oversold reading. The professional waits for all four to align.
The Confluence Framework: When All Four Align
The professional setup requires confluence across all four timeframes. Here's what it looks like for each direction.
Ideal bull put spread setup (mean reversion within an uptrend). 14-day RSI above 55, confirming the intermediate uptrend. 9-day RSI above 50, confirming no rollover in the intermediate timeframe. 5-day RSI below 30, indicating a short-term pullback. 2-day RSI below 10, indicating extreme short-term oversold pressure. This combination says: the stock is in a clear uptrend, but it's experiencing a short-term pullback that's reached exhaustion. Selling a bull put spread at this moment means you're selling fear at a point where the probability of mean reversion toward the trend is elevated. Combine this with IV Percentile above 50 (confirming the volatility risk premium is wide) and you have a high-probability entry.
Ideal bear call spread setup (mean reversion within a downtrend). 14-day RSI below 45, confirming the intermediate downtrend. 9-day RSI below 50, confirming continued weakness. 5-day RSI above 70, indicating a short-term bounce. 2-day RSI above 90, indicating extreme short-term overbought pressure. The stock is in a clear downtrend experiencing a short-term bounce that's reached exhaustion. Selling a bear call spread at this moment captures the high probability that the broader downtrend reasserts itself.
The cautionary signal: divergence. When the four timeframes do not align, the setup is ambiguous. If 14-day RSI is bullish but 9-day is turning bearish, the intermediate trend is weakening. Professionals do not enter credit spreads during these transition periods. Wait for realignment. The premium will still be there tomorrow, or next week, or on a different underlying.
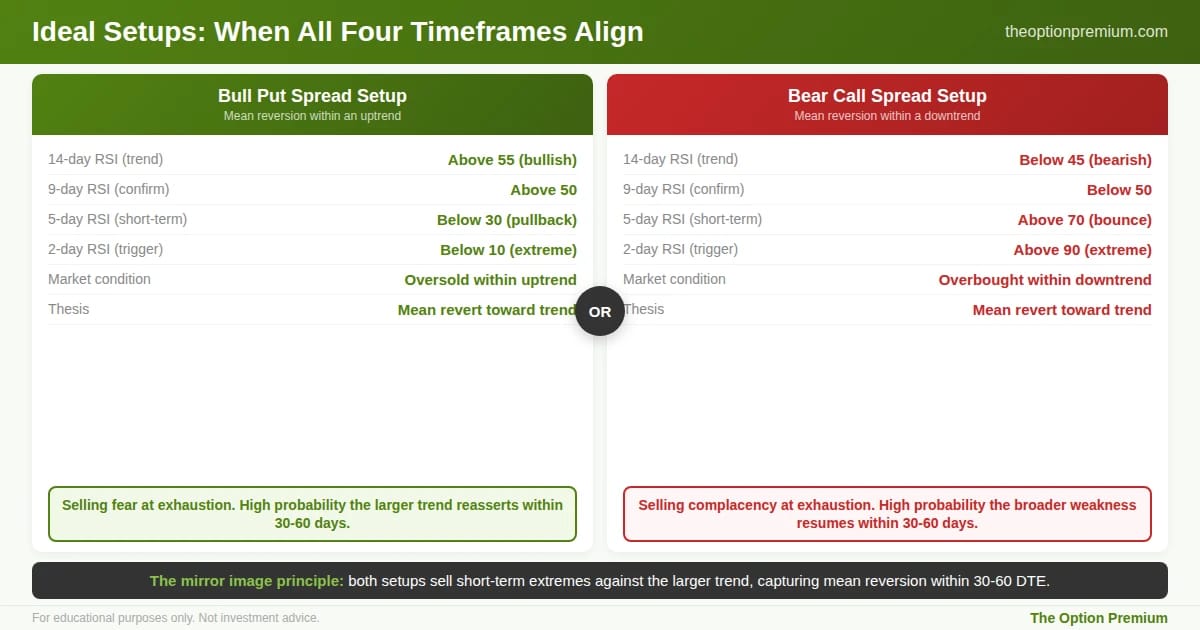
The mirror image principle: both ideal setups sell short-term extremes against the larger trend. For bull put spreads: 14-day RSI above 55 (intermediate uptrend), 9-day above 50 (confirming), 5-day below 30 (short-term pullback), 2-day below 10 (extreme oversold). For bear call spreads: the reverse. In both cases, you're selling fear or complacency at exhaustion points where mean reversion toward the broader trend has high probability within the 30-60 day window. Divergences across the four timeframes signal transitions where professionals wait for realignment.
Strike Selection With RSI as a Supplementary Input
Once RSI has established the directional bias (bull put vs bear call) and the timing (all four timeframes aligned), the actual strike placement still follows the core premium-selling framework.
Short strikes at 0.15-0.20 delta, outside the one standard deviation expected move. 30 to 60 DTE entry window. Credit targeting approximately one-third of the spread width. Position sizing at 2-5% max loss. None of these rules change because you're using RSI. What changes is that you're now placing a high-probability structure in the direction that multi-timeframe momentum supports, at the moment when short-term extremes suggest mean reversion is imminent.
The RSI confluence doesn't give you permission to sell closer to the money. It gives you higher conviction on the direction you're already selling, at the timing most likely to benefit from mean reversion within the next 30 to 60 days.
Additional Data That Sharpens the Analysis
RSI is a strong framework, but combining it with other data sources improves the accuracy of setups significantly. A professional premium seller layers these inputs in order to build conviction before placing capital.
IV Percentile (the most important additional input). RSI tells you direction and timing. IV Percentile tells you whether the trade is worth placing at all. If all four RSI timeframes align beautifully but IVP is below 40, the premium isn't rich enough to justify the trade. Wait for an IV expansion. Conversely, when IVP is above 60 AND RSI alignment is present, you have the rare combination where direction, timing, and volatility risk premium all favor the trade simultaneously.
The 200-day moving average as a bigger-picture trend filter. RSI measures momentum over weeks. The 200-day moving average tells you whether the stock is in a multi-month or multi-year uptrend. Trading with the 200-day trend, rather than against it, significantly improves long-term results. If the stock is above its 200-day moving average and your 14-day RSI is bullish, you have trend agreement at both the intermediate and long-term levels. If the stock is below its 200-day but your 14-day RSI is turning bullish, you might be selling into a counter-trend rally that's about to fail.
The Average True Range (ATR). ATR tells you how far the stock typically moves on an average day. This contextualizes your strike placement. If RSI alignment suggests a bull put spread, and your short strike is 2x the ATR below current price, you have a meaningful buffer. If your short strike is only 1x ATR below, a single normal trading day could test the position. ATR also calibrates position sizing: volatile stocks (high ATR% relative to price) warrant smaller positions even when RSI alignment is perfect.
Support and resistance levels. When RSI extremes align with a clear technical support level (for bull puts) or resistance level (for bear calls), the conviction increases significantly. A stock experiencing a 2-day RSI below 10 at a major multi-month support level is a much stronger bull put setup than the same RSI reading in open territory with no nearby support. The technical level gives the mean-reversion thesis a structural anchor.
Market breadth and sector context. Individual stock RSI signals are less reliable when the broader market or sector is under pressure. If your stock shows a perfect bull put setup on RSI alignment but the S&P 500 is breaking down and the sector is in a clear downtrend, the individual signal is likely to be overwhelmed by macro pressure. Check the broader market's 14-day RSI and the sector ETF's RSI before trusting an individual stock's alignment. When stock, sector, and market all point the same direction, the setup is highest conviction.
Volume confirmation. RSI extremes backed by meaningful volume are more reliable than RSI extremes on light volume. A 2-day RSI below 10 on heavy selling volume suggests genuine capitulation. The same reading on thin holiday-week volume is often noise that reverses without a meaningful move.
The earnings calendar. This is a disqualifier rather than an accuracy enhancer. Any RSI setup within two weeks of an earnings announcement should be evaluated separately. Earnings introduce binary risk that RSI cannot capture, and the standard 30-60 DTE strike selection framework needs to be modified to either exit before the event or treat the position as an intentional earnings trade sized accordingly.
Put/call ratio as a sentiment extreme check. Extreme put/call ratios (high put buying) at the same moment as oversold RSI readings confirm fear extremes. Extreme put/call ratios in the opposite direction confirm complacency extremes. Sentiment data aligned with RSI extremes is additional confirmation that mean reversion is likely.
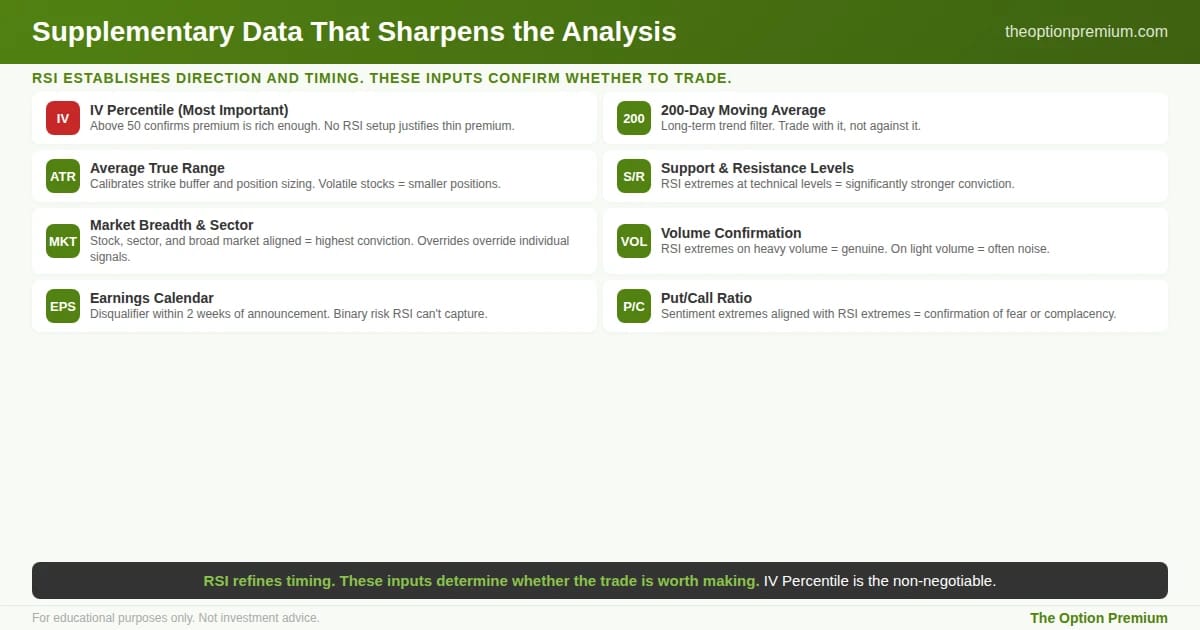
The supplementary inputs that turn RSI alignment into actionable trades. IV Percentile is non-negotiable: even perfect RSI confluence in a low IV environment produces thin premium. The 200-day moving average adds the longer-term trend filter. ATR calibrates your buffer and position size. Support/resistance levels provide structural anchors for the mean-reversion thesis. Market breadth and sector context prevent individual signals from being overwhelmed by macro pressure. Volume confirms whether RSI extremes reflect real participation. The earnings calendar disqualifies any setup within two weeks of an announcement. Put/call ratio confirms sentiment extremes aligned with RSI extremes.
A Complete Example
Consider a theoretical setup on SPY. Current price: $550. The following conditions exist on a given trading day.
14-day RSI: 58 (bullish intermediate trend). 9-day RSI: 55 (confirming). 5-day RSI: 28 (short-term oversold). 2-day RSI: 8 (extreme oversold). IV Percentile: 62 (elevated). SPY is above its 200-day moving average. The recent pullback is approaching a clear support level at $545. The VIX is at 18 but has moved up 4 points in the past three days, contributing to the IV expansion. No earnings in the window. Put/call ratio is at 1.15 (elevated put buying).
Every element aligns. The direction is clear (bull put spread). The timing is precise (all four RSI timeframes confirming short-term exhaustion within a longer-term uptrend). The volatility environment is favorable (IVP above 50). The technical context supports the thesis (approaching support, above 200-day). Sentiment confirms the fear extreme (put/call ratio elevated).
The trade: bull put spread on SPY, 45 DTE, short strike at 0.15 delta (roughly $525), long strike at $520 for a $5 wide spread. Credit collected: approximately $1.65 per contract. Max loss: $3.35 per contract. Position sized at 3% of account equity based on the $3.35 max loss.
This is the kind of setup a professional premium seller would take with conviction. Not because any single indicator was bullish, but because every layer of analysis pointed in the same direction at the same moment.
Common Mistakes to Avoid
Trading on a single RSI timeframe. The 14-day alone, or the 2-day alone, produces far too many false signals. Confluence across multiple timeframes is the entire point of the multi-period framework.
Ignoring divergence between timeframes. When the 14-day is bullish but the 9-day is rolling over, the setup is weakening. Professionals wait for realignment. Amateurs trade through divergence and lose to the emerging trend change.
Using RSI without IV Percentile. Even a perfect RSI setup in a low IV environment produces thin premium that doesn't justify the risk. The volatility risk premium is the foundational edge. RSI refines entry timing within that edge, but it doesn't create the edge itself.
Letting the 2-day RSI override the 14-day trend. The 2-day RSI is the entry trigger, not the directional tool. Selling a bull put spread based on extreme 2-day oversold readings in a clearly downtrending stock (14-day RSI below 40) is fighting the larger trend. The mean reversion may not arrive, and the position can be tested repeatedly.
Risk Reality Check
Multi-timeframe RSI analysis improves the quality of entry timing and directional bias for credit spread selection. It does not eliminate losses. Any stock can continue trending beyond RSI extremes longer than a credit spread can survive. Any stock can gap on news unrelated to the technical setup. Any sector can experience sudden correlation breakdowns that invalidate individual-stock signals.
The framework described here is designed to increase the probability of favorable outcomes across many trades, not to guarantee outcomes on any individual trade. Position sizing at 2-5% per trade, diversification across uncorrelated underlyings, and process discipline during drawdowns remain the structural protections that let the law of large numbers work on the RSI-improved signal.
Key Takeaways
The 14-day RSI establishes the intermediate trend (above 50 = bullish bias for bull put spreads; below 50 = bearish bias for bear call spreads). The 9-day confirms the intermediate momentum. The 5-day identifies short-term extremes within that trend. The 2-day is the precision entry trigger. Each period serves a specific purpose, and confluence across all four is what creates high-conviction setups.
The ideal bull put spread setup: 14-day RSI above 55, 9-day above 50, 5-day below 30, 2-day below 10. The ideal bear call spread setup is the mirror image: 14-day below 45, 9-day below 50, 5-day above 70, 2-day above 90. When the timeframes diverge, professionals wait for realignment rather than trading through transitions.
RSI does not replace the foundational premium-selling framework. Strike placement still follows 0.15-0.20 delta at 30-60 DTE with credit at one-third of spread width. Position sizing stays at 2-5% max loss per trade. RSI refines the direction and timing of trades you would already be making based on IV and volatility risk premium considerations.
The most important additional data source is IV Percentile. Even perfect RSI alignment in a low IV environment produces thin premium. IVP above 50 combined with RSI confluence is the rare setup where direction, timing, and volatility risk premium all favor the trade simultaneously. Other valuable inputs: 200-day moving average, ATR, support and resistance levels, market breadth, volume, earnings calendar, and put/call ratio.
Common mistakes include trading on a single timeframe, ignoring divergence, using RSI without IV context, and letting the 2-day RSI override the larger trend. The 2-day is the entry trigger, not the directional tool. Selling against the 14-day trend on a 2-day extreme is fighting the larger momentum.
Multi-timeframe RSI is a professional's tool because it reflects a professional's patience. The amateur trades every oversold reading. The professional waits for the setup where the shortest timeframe's extreme confirms what the intermediate and longer timeframes have already established. That patience filters out most false signals and concentrates capital in the entries where the probability of mean reversion is highest. Combine it with the IV, delta, and sizing framework that governs all premium selling, and RSI becomes one of the most reliable entry-refinement tools available.
Andy Crowder
📩 Want to see how a 24+ year professional options trader approaches the market?
Subscribe to The Option Premium, my free weekly newsletter where I share:
Probability-based strategies that actually work: credit spreads, cash-secured puts, the wheel, LEAPS, poor man's covered calls, and more
Real trade breakdowns with the math behind every decision
Market insights for any environment, whether we're grinding higher, pulling back, or chopping sideways
No hype. No predictions. Just the frameworks I've used to trade options for over two decades.
📺 Want more? Follow me on YouTube for in-depth tutorials, live trade analysis, and the kind of education you won't find anywhere else.
Connect with me:
This newsletter is for educational purposes only and should not be considered investment advice. Options trading involves significant risk and is not suitable for all investors. Past performance does not guarantee future results. Always consult with a qualified financial professional before making investment decisions.
Reply