- The Option Premium
- Posts
- Why I Sell Monthly Options Over Weeklies: Four Data-Driven Reasons
Why I Sell Monthly Options Over Weeklies: Four Data-Driven Reasons
Four data-driven reasons monthly options beat weeklies for premium sellers: 2.6x lower gamma risk, OTM theta reality, 2.6x wider distribution buffer, and 18-22% better net P&L per dollar of risk.

Why I Sell Monthly Options Over Weeklies: Four Data-Driven Reasons
Weeklies are seductive. Faster theta decay. Quicker capital turnover. The dopamine hit of collecting premium every five trading days. I understand the appeal. I traded weeklies aggressively for years before the data convinced me to stop.
The problem isn't that weeklies can't work. It's that the math works against you in ways that aren't obvious until you stress-test the numbers. The gamma risk is exponentially higher. The theta decay on out-of-the-money options isn't what the textbooks show you. The distribution curves are dangerously tight. And the operational burden of managing positions that expire every Friday is a treadmill that degrades decision quality over time.
After 23 years of selling premium, the data is clear: monthly options (30-45 DTE) balance risk and reward more favorably for disciplined sellers than weeklies ever can. Here are the four reasons, backed by the mechanics that drive them.
Reason 1: Gamma Risk Is the Silent Killer
Gamma is the rate of change of delta. It tells you how fast your position's directional exposure changes as the stock moves. And gamma accelerates exponentially as expiration approaches.
Here's what that means in practical terms. You sell a 0.16 delta put spread on SPY with 35 DTE. SPY drops 1% ($6.60). Your short put's delta might move from 0.16 to 0.22. A modest shift. You have time to evaluate, adjust, or hold. The position is manageable.
Now sell the same 0.16 delta put spread with 5 DTE. SPY drops 1%. Your short put's delta might jump from 0.16 to 0.45 or higher. In a single session, your position has gone from a high-probability out-of-the-money trade to a near-coin-flip. A second 1% move and you're staring at max loss with no time to react.
The math is unforgiving. Gamma for an at-the-money option is roughly proportional to 1 divided by the square root of time to expiration. Cut the time from 35 days to 5 days, and gamma increases by a factor of roughly 2.6x. That means the same stock move produces 2.6 times the delta change on a weekly versus a monthly.
For premium sellers, this matters enormously. We profit by being approximately right about direction (or at least not catastrophically wrong). Monthlies give you that tolerance. A 1% adverse move at 35 DTE is a nuisance. The same move at 5 DTE is a crisis. The longer horizon dampens gamma's bite, giving you breathing room to be less perfect on direction. And in a strategy built on probabilities, not predictions, that breathing room is everything.

Same 0.16 delta put spread. Same 1% SPY drop. Completely different outcomes. On the weekly (5 DTE), delta jumps from 0.16 to 0.45+, a 181% increase. Your high-probability trade is now a near-coin-flip, and you have hours to react. On the monthly (35 DTE), delta moves from 0.16 to 0.22, a 38% increase. The position is still manageable OTM, and you have days to weeks to evaluate and adjust. Gamma is roughly 2.6x higher at 5 DTE than at 35 DTE. That multiplier is the difference between a nuisance and a crisis.
Reason 2: Theta Decay Isn't What the Textbooks Show You
Every options textbook shows the same chart: theta decay accelerates in the final 30 days, with the steepest decline in the last two weeks. The curve looks like a hockey stick, and the implication is clear: sell weeklies to capture that steep decline.
There's a problem with this picture. That steep theta curve is for at-the-money options. Premium sellers don't trade at-the-money. We trade out-of-the-money. And OTM theta decay behaves very differently.
An OTM option with 5 DTE doesn't have much time value left to decay. If you sold a 0.16 delta put at 7 DTE for $0.40, there isn't a lot of premium left to collect. The theta might be $0.06 per day, but the absolute dollars are tiny. And here's the counterintuitive part: as the OTM option approaches expiration with the stock well above the strike, the remaining time value can decay very slowly because the option is already nearly worthless. The decay curve flattens out.
Monthly options tell a different story. At 30-45 DTE, an OTM option has substantial time value remaining, and theta is eroding it consistently day after day. A 0.16 delta SPY put at 35 DTE might have $1.50 of premium and decay at $0.03-$0.04 per day. After 20 days, you've captured $0.60-$0.80 of decay, or 40-53% of the premium. The decay is steady, reliable, and the absolute dollar amount per day is meaningful relative to the premium collected.
The 30-45 DTE sweet spot exists for a reason. This is where theta decay per day of risk exposure is optimized. You're earning the most time decay per day of capital commitment. Earlier than 45 DTE, and the per-day theta is lower (your capital is committed longer for less daily income). Later than 30 DTE (moving toward expiration), gamma starts to dominate, and the risk-per-dollar-of-theta increases sharply.
When I enter a credit spread or iron condor at 35 DTE and close at 50% of max profit (typically around day 15-20), I'm harvesting the most efficient portion of the theta curve while exiting before gamma takes over. Weeklies don't offer this luxury. You're always in the gamma zone.
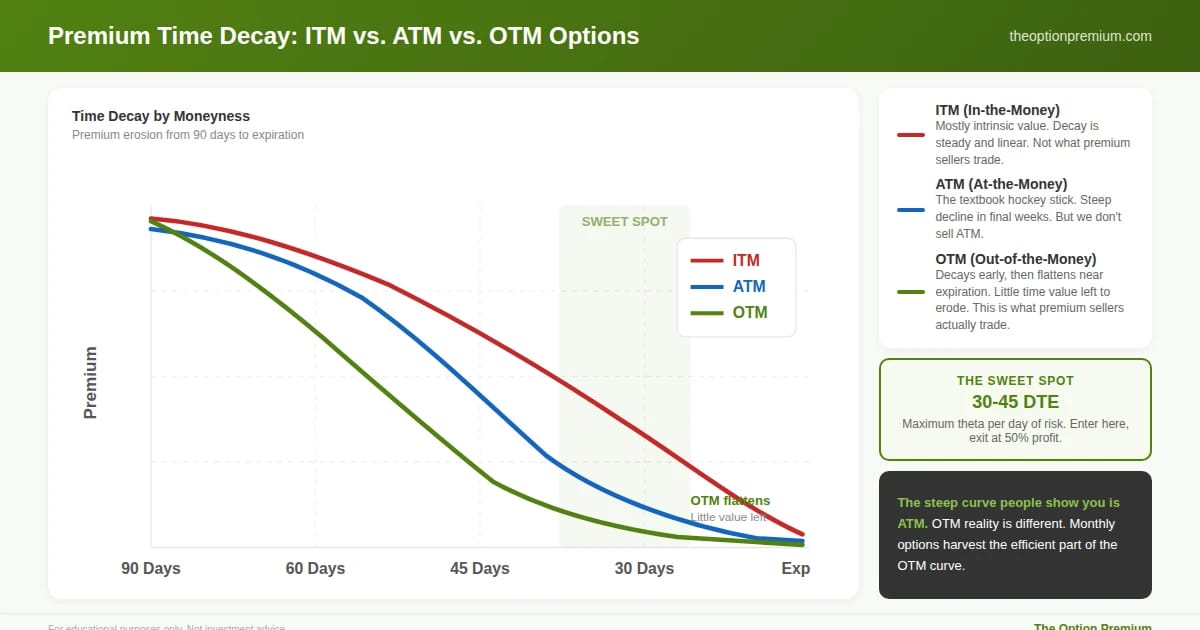
The chart everyone shows you is the ATM curve (blue): the classic hockey stick with steep decline in the final weeks. But premium sellers don't trade ATM. We trade OTM (green), and OTM theta behaves differently. OTM options decay steadily from 90 to 30 days, then the curve flattens as expiration approaches because there's little time value left to erode. The 30-45 DTE sweet spot (highlighted) is where theta decay per day of risk exposure is optimized. Enter here, close at 50% profit around day 15-20, and you harvest the efficient part of the OTM curve without ever entering the zone where decay flattens.
Reason 3: Distribution Curves Matter More Than You Think
The expected move is based on implied volatility and time. More time means a wider distribution of possible outcomes. This sounds like it should favor weeklies (tighter distributions mean your strikes are "safer" in absolute terms). But the opposite is true.
With weeklies, your 1 SD position is dangerously close to at-the-money. SPY at $660 with 23% IV and 5 DTE. Expected move: $660 x 0.23 x sqrt(5/365) = $17.76. Your 1 SD short put is at $642. That's only 2.7% below the current price. A single bad day (SPY drops 2%) and your "one standard deviation" position is at the money. A second bad day and you're deep in the money.
With monthlies, that same 1 SD position has real statistical buffer. SPY at $660 with 23% IV and 35 DTE. Expected move: $660 x 0.23 x sqrt(35/365) = $47.00. Your 1 SD short put is at $613. That's 7.1% below the current price. SPY would need to drop 7% before your 1 SD position is threatened. That kind of move in 35 days is genuinely uncommon, not impossible, but uncommon enough that the probabilities are working meaningfully in your favor.
The numbers tell the story clearly. At 5 DTE, a 1 SD put is 2.7% away. At 35 DTE, it's 7.1% away. The weekly position is 2.6 times more vulnerable to being tested by a routine market move. And here's the critical point: the premium you collect on a weekly at 1 SD is often not proportionally higher enough to compensate for this dramatically tighter buffer. You're getting paid slightly more per day of exposure, but your margin for error has collapsed.
You're not just selling premium with monthlies. You're buying safety. The wider distribution gives you a genuine statistical buffer that weeklies simply cannot provide at the same delta. This is why I sell at 0.15-0.20 delta with 30-45 DTE: the combination of delta and time creates a position that's outside the range of normal market fluctuations for the entire life of the trade.

The numbers make this concrete. SPY at $660, 23% IV. A 1 SD put position on a weekly (5 DTE) sits at $642, just 2.7% below the stock. One 2% down day and you're nearly ATM. Two bad days and you're deep ITM. The same 1 SD position on a monthly (35 DTE) sits at $613, 7.1% below the stock. After a 2% down day, you're still 5.1% OTM. After two bad days, still 3.1% OTM. The monthly position is 2.6x further from danger. You're not just selling premium with monthlies. You're buying safety.
Reason 4: Weekly Options Are a Trader's Treadmill
Beyond the Greek-level mechanics, there's an operational and psychological argument against weeklies that rarely gets discussed.
Weeklies require constant monitoring. When your position expires in 5 days, every intraday move matters. A gap down at the open demands immediate evaluation. A late-day reversal changes the risk profile significantly. You're checking the position multiple times per day, and that monitoring creates emotional responses that degrade decision quality. Fear, urgency, the impulse to micro-manage. All amplified by the compressed timeframe.
The capital turnover argument is misleading. Weekly sellers argue they can sell premium 4-5 times per month versus once on a monthly cycle, generating more total premium. In theory, yes. In practice, the higher loss rate (gamma-driven), wider bid-ask spreads on less liquid weekly strikes, and the transaction cost of entering and exiting 4-5 times instead of once often eat into the theoretical advantage. When I tracked my own weekly versus monthly performance over a two-year period, my net P&L per dollar of risk deployed was 18-22% higher on monthlies, even though weeklies generated more gross premium.
The whipsaw factor. Weekly positions are more susceptible to short-term noise: a tweet, an intraday reversal, an overnight futures move. These events don't change the underlying's value by much, but they can swing a weekly position from profitable to max-loss in hours. Monthly positions absorb these events as noise. The stock dips 1.5% on a headline, and your 35 DTE credit spread barely notices. The same headline on a 5 DTE position triggers a cascade of delta changes, gamma acceleration, and potential forced exits.
Precision is overrated when time is on your side. Weeklies demand you be right about direction, timing, and magnitude in a compressed window. Monthlies require only that the stock doesn't make a sustained multi-percentage-point move against you over a month. The skill required is fundamentally different: weeklies are a timing game, monthlies are a probability game. And probability games, played consistently with proper position sizing, are how wealth is built over decades.
The Practitioner Edge: How I Structure Monthly Trades
Here's the practical framework that puts all four reasons together.
Entry at 30-45 DTE. Specifically targeting 35-40 DTE for the optimal theta-per-day-of-risk ratio. SPY's multiple weekly expirations let me dial in this target within 1-2 days.
Delta selection at 0.15-0.20. On a 35 DTE position, this places my short strikes well outside the 1 SD expected move. The combination of delta and time creates the statistical buffer that makes this a probability game, not a prediction game.
Close at 50% of max profit. On a typical credit spread, this happens around day 15-20. I've captured the efficient portion of the theta curve and I'm exiting before gamma starts to matter. My capital is freed to deploy on a new 35 DTE position.
IV Percentile above 50% as the entry filter. When IV Percentile is elevated, the expected move is wider (my strikes are further from the stock in absolute terms) and the premium is richer (my income per trade is higher). Both factors compound the advantage of monthly options.
Never hold past 10 DTE. Even on a monthly position, the final 10 days bring gamma acceleration. If the position hasn't hit 50% profit by 10 DTE, I close at whatever P&L exists and move to the next cycle. This hard exit keeps me permanently on the right side of the gamma curve.
The result: I'm always in the 10-35 DTE window during the life of a trade. I enter where theta is optimized, hold during the efficient decay period, and exit before gamma takes over. Weeklies, by definition, start in the gamma danger zone and never leave it.

The practical framework that puts all four reasons together. Enter at 35-40 DTE (optimal theta per day of risk). Hold during the 15-35 DTE window (theta working, gamma manageable, room to adjust). Exit at 50% profit, typically around day 15-20 (capturing the efficient part of the curve). Hard exit by 10 DTE regardless of P&L (before gamma takes over). Four supporting rules: 0.15-0.20 delta, IVP above 50%, close at 50% profit, never past 10 DTE. The result: you're always in the sweet spot and never in the gamma danger zone. Weeklies, by definition, start in the danger zone and never leave it.
Risk Reality Check
Monthly options aren't risk-free. A sustained multi-week selloff can test a 35 DTE credit spread just as a single-day gap can test a weekly. The difference is the speed at which the damage occurs and your window to respond. On a monthly, a 3% adverse move over a week gives you days to evaluate and adjust. On a weekly, the same move might happen in two sessions and your position is at max loss before you can react.
Monthly options also require more patience. The capital is committed for 15-20 days per trade cycle versus 3-5 days on weeklies. If you're measuring success by how often you're collecting premium, weeklies feel more productive. But productivity isn't profitability. The premium seller who makes 12 well-managed monthly trades per year and nets +$15,000 has outperformed the weekly seller who makes 50 trades and nets +$10,000, and the monthly seller did it with less stress, less screen time, and fewer decisions to get wrong.
Key Takeaways

Gamma risk is the silent killer of weekly options sellers. Gamma is roughly 2.6x higher at 5 DTE than at 35 DTE, meaning the same stock move produces 2.6 times the delta change. Monthly options dampen gamma's bite, giving you breathing room to be less perfect on direction.
Theta decay on OTM options isn't the steep hockey stick the textbooks show. That curve is for ATM options. OTM theta decay flattens as expiration approaches because there's little time value left to erode. Monthly options at 30-45 DTE offer the most efficient theta decay per day of risk exposure, which is why the 35 DTE entry with a 50% profit target captures the sweet spot of the curve.
Weekly distribution curves are dangerously tight. A 1 SD position at 5 DTE is only 2.7% from the current price on SPY. At 35 DTE, it's 7.1%. The monthly position provides 2.6x more buffer, which means you're not just selling premium with monthlies. You're buying safety.
Weeklies are a trader's treadmill: constant monitoring, amplified emotional responses, susceptibility to short-term noise, and a capital turnover advantage that often disappears when you account for higher loss rates and transaction costs. My own two-year tracking showed 18-22% higher net P&L per dollar of risk on monthlies versus weeklies.
The practical framework: enter at 35-40 DTE, sell at 0.15-0.20 delta, close at 50% of max profit (around day 15-20), require IVP above 50%, and never hold past 10 DTE. This keeps you permanently in the efficient portion of the theta curve and out of the gamma danger zone.
Weeklies feel like you're working harder. Monthlies feel like you're working smarter. The data says the feeling is correct.
Andy Crowder
📩 Join thousands of readers building a professional foundation.
Subscribe to The Option Premium and learn to trade with confidence and clarity.
📺 Want more education and community?
🎥 Subscribe on YouTube for in-depth tutorials and live trade breakdowns.
📘 Join the conversation on Facebook for exclusive insights, discussions, and real-time updates.
Disclaimer: This is educational content only. Not investment, tax, or legal advice. Options involve risk and aren't suitable for all investors. Examples are illustrative. Real results will vary. Talk to professionals before you risk real money.
Reply