- The Option Premium
- Posts
- Expectancy: The Single Number That Predicts
Expectancy: The Single Number That Predicts
Learn why win rate is a vanity metric and how to calculate expectancy, the one number that reveals whether your options trading strategy will actually make money.

Expectancy: The Single Number That Predicts Your Trading Success
Why most traders focus on win rate when they should be obsessing over this instead
Ask most traders how they're doing, and they'll tell you their win rate.
"I'm winning 70% of my trades."
"My last ten trades? Eight winners."
It sounds impressive. It feels good. And it's almost completely meaningless.
Here's the uncomfortable truth that separates professionals from everyone else. Win rate, by itself, tells you nothing about whether you'll make money.
A trader with a 40% win rate can crush a trader winning 80% of the time. It happens constantly. And the reason comes down to one number most traders have never calculated for their own system.
That number is expectancy.
What Is Expectancy?
Expectancy is the average amount you expect to make (or lose) per dollar risked, over a large sample of trades.
It's the single number that predicts whether your trading approach will make money over time. Or slowly bleed you dry.
The formula looks like this:
Expectancy = (Win Rate × Average Win) – (Loss Rate × Average Loss)
Or, expressed in R-Multiple terms (which we covered last week):
Expectancy = (Win Rate × Average R-Win) – (Loss Rate × Average R-Loss)
Let's make this concrete.
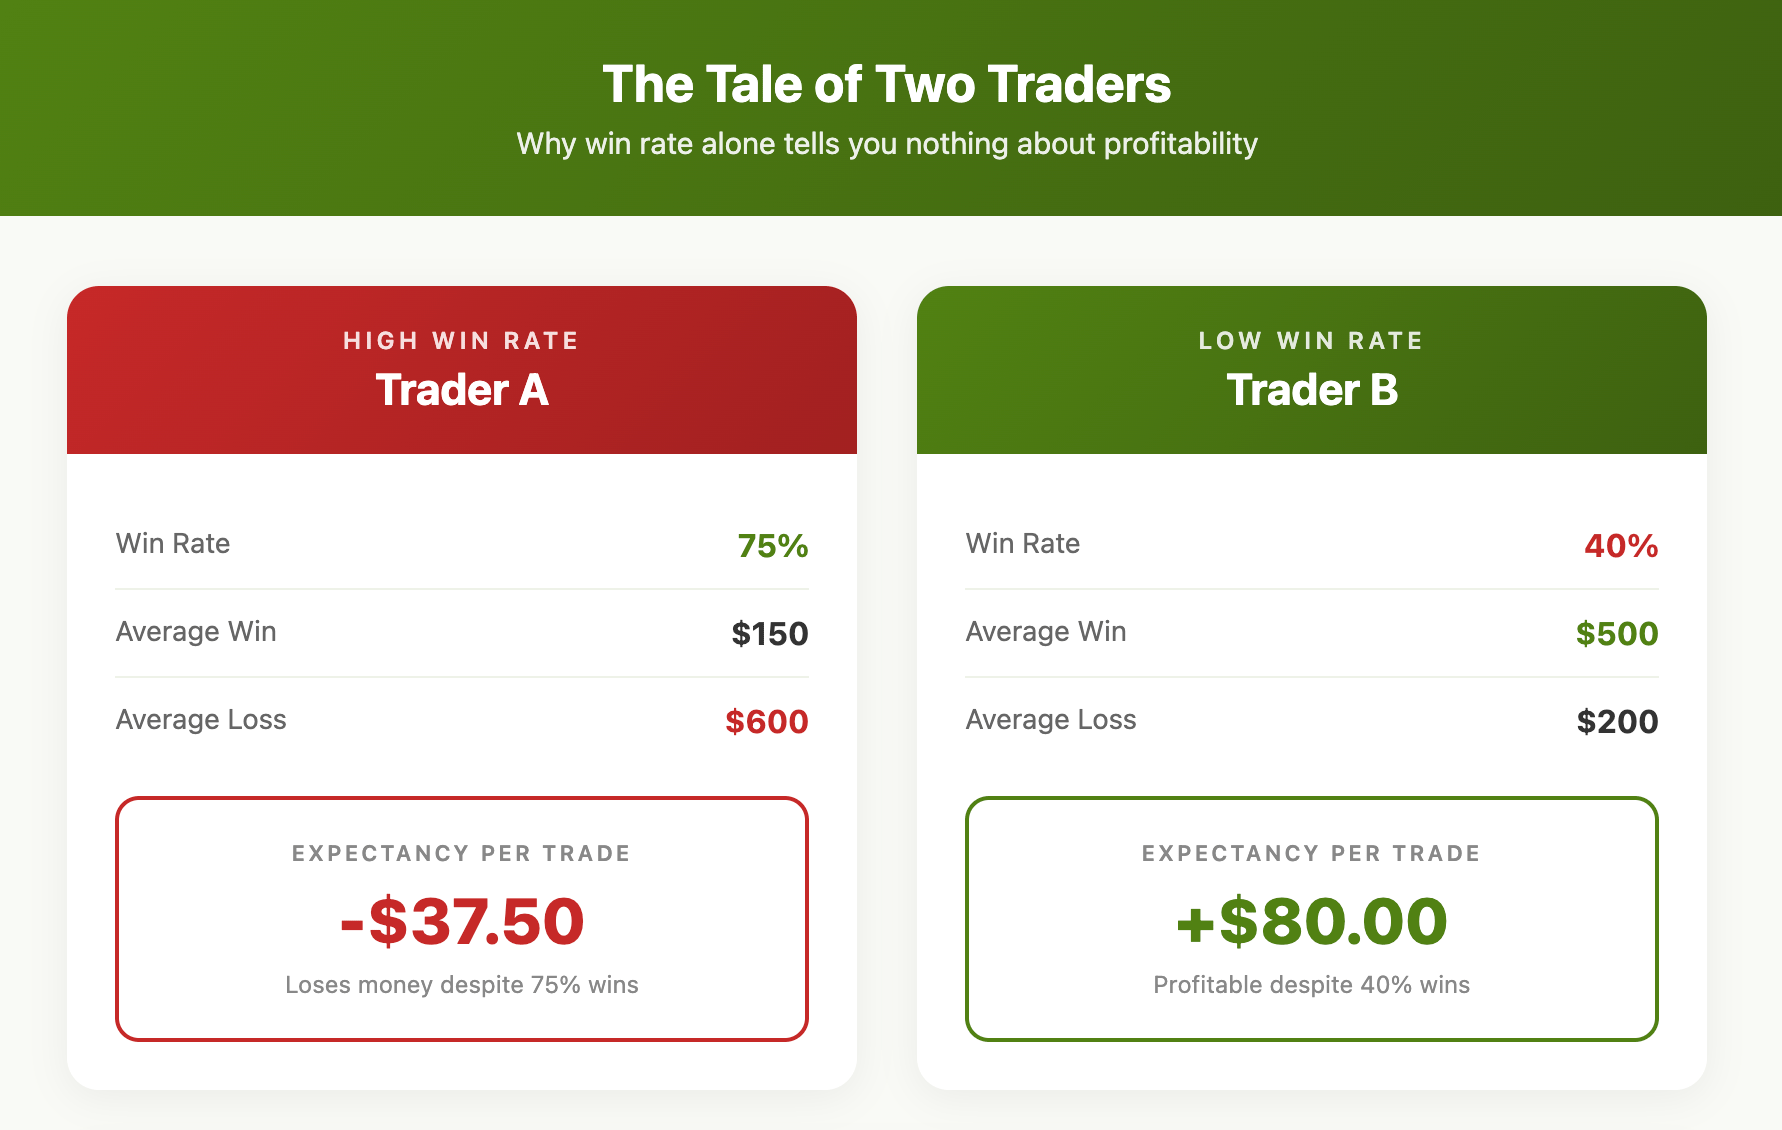
The Tale of Two Traders
Trader A wins 75% of their trades. Impressive, right? But here's the full picture:
Win rate: 75%
Average win: $150
Average loss: $600
Expectancy = (0.75 × $150) – (0.25 × $600) Expectancy = $112.50 – $150 Expectancy = –$37.50 per trade
Despite winning three out of every four trades, Trader A is guaranteed to lose money over time. Every trade, on average, costs them $37.50.
Trader B wins just 40% of their trades. Sounds mediocre. But look closer:
Win rate: 40%
Average win: $500
Average loss: $200
Expectancy = (0.40 × $500) – (0.60 × $200) Expectancy = $200 – $120 Expectancy = +$80 per trade
Trader B loses more often than they win. Yet every trade adds, on average, $80 to their account.
Over 100 trades:
Trader A loses $3,750
Trader B gains $8,000
This is why win rate is a vanity metric. Expectancy is the truth.
Why Options Sellers Must Understand This
If you sell premium (cash-secured puts, credit spreads, iron condors) you're playing a specific expectancy game.
Your win rate is high. Depending on your strike selection, you might win 70%, 80%, even 85% of your trades. The probabilities are stacked in your favor.
But here's the catch. Your average win is typically smaller than your potential loss.
Sell a $5-wide put spread for $1.00 credit, and you're risking $4.00 to make $1.00. Your win rate needs to be above 80% just to break even.
This isn't a flaw. It's the structure of the strategy. Premium selling trades a high win rate for asymmetric risk. The question is whether your actual expectancy is positive once you account for:
Commissions and fees
The trades that blow through your short strike
The adjustments that reduce your credit
The early exits that capture less than maximum profit
Most premium sellers feel profitable because they win often. But feelings aren't math. Expectancy is math.
Calculating Your Real Expectancy
Here's how to find your actual number:
Step 1: Pull your last 50 to 100 trades.
The more data, the more accurate your expectancy calculation. Anything under 30 trades is statistical noise.
Step 2: Calculate your win rate.
Winning trades ÷ Total trades = Win Rate
Step 3: Calculate your average win and average loss.
Sum of all winning trade profits ÷ Number of winning trades = Average Win
Sum of all losing trade losses ÷ Number of losing trades = Average Loss
Step 4: Plug into the formula.
Expectancy = (Win Rate × Average Win) – (Loss Rate × Average Loss)
Step 5: Convert to R-Multiples for clarity.
If you defined your initial risk on each trade (your "R"), calculate:
Expectancy in R = (Win Rate × Avg R-Win) – (Loss Rate × Avg R-Loss)
This tells you how much R you expect to earn per trade. An expectancy of +0.25R means every trade adds, on average, a quarter of your initial risk to your account.

What Good Expectancy Looks Like
There's no magic number. Context matters. But here are some benchmarks:
For high-probability strategies (premium selling, 65%+ win rate):
Expectancy of +0.10R to +0.30R per trade is solid
Below +0.10R, you're barely covering costs
Negative expectancy means your "high probability" strategy is a slow leak
For lower win-rate strategies (trend following, 35% to 50% win rate):
Expectancy of +0.30R to +0.80R per trade is typical
You're compensated for losing more often with bigger average wins
For any strategy:
Positive expectancy + consistent position sizing + enough trades = profit
Negative expectancy + anything else = inevitable loss
The math is unforgiving. But that's precisely why it's useful.
The Expectancy Mindset Shift
Here's where expectancy changes your psychology.
When you know your expectancy is positive, individual losses stop mattering. They're just part of the distribution. They're not failures. They're data points confirming your edge is working as expected.
Van Tharp called this "trading your expectancy, not your emotions."
You stop asking, "Why did that trade lose?" and start asking, "Is my expectancy still positive over the last 50 trades?"
You stop celebrating individual wins and start tracking whether your average R-win is holding steady.
You stop fearing drawdowns and start recognizing them as normal variance in a positive-expectancy system.
This is the professional's mindset. Not hope. Not prediction. Just math, executed consistently.
When Expectancy Lies to You
A few warnings:
Small samples deceive. Twenty trades isn't enough data. You could have +0.50R expectancy on 20 trades and still be running a losing system. Variance hides in small numbers.
Market regimes matter. Your expectancy in a low-volatility, grinding bull market might not survive a regime shift. Calculate expectancy across different conditions if you have enough data.
Expectancy assumes consistent execution. If you're oversizing on "high conviction" trades or undersizing when scared, your actual results won't match your calculated expectancy.
Costs eat your edge. Commissions, slippage, assignment fees. They all reduce expectancy. Calculate your number after costs, not before.
Your Homework This Week
Go back through your trading journal (you do have one, right?) and calculate your expectancy over the last 50+ trades.
You don't need fancy software. A spreadsheet works fine. Three columns: Trade, Initial Risk, Result in R.
What you find might surprise you. Traders often discover their "best" trades in dollar terms were actually mediocre in risk-adjusted terms. While their "boring" trades were the real gems.
That's the power of speaking the universal language.
The Bottom Line
Win rate flatters. Expectancy tells the truth.
A positive expectancy doesn't guarantee any single trade will win. It guarantees that over enough trades, you'll come out ahead. If you execute consistently and let the math work.
Van Tharp spent decades teaching this principle to professional traders. Mark Douglas built his entire philosophy around it. Every successful systematic trader eventually arrives at the same conclusion:
The goal isn't to be right. The goal is to have a positive expectancy. And then trade enough for it to matter.
That's the game. Everything else is distraction.
Probabilities over predictions,
Andy
Next week: Position Sizing, Van Tharp's Golden Rule. Because once you have positive expectancy, the only question that matters is: how much should you risk?
📩 Want to see how a 24+ year professional options trader approaches the market?
Subscribe to The Option Premium, my free weekly newsletter where I share:
Probability-based strategies that actually work: credit spreads, cash-secured puts, the wheel, LEAPS, poor man's covered calls, and more
Real trade breakdowns with the math behind every decision
Market insights for any environment, whether we're grinding higher, pulling back, or chopping sideways
No hype. No predictions. Just the frameworks I've used to trade options for over two decades.
📺 Want more? Follow me on YouTube for in-depth tutorials, live trade analysis, and the kind of education you won't find anywhere else.
Connect with me:
This newsletter is for educational purposes only and should not be considered investment advice. Options trading involves significant risk and is not suitable for all investors. Past performance does not guarantee future results. Always consult with a qualified financial professional before making investment decisions.
Reply