- The Option Premium
- Posts
- Best Stocks for Credit Spreads: A 7-Step Selection Framework
Best Stocks for Credit Spreads: A 7-Step Selection Framework
How to find the best stocks for credit spreads using liquidity, IV rank, IV percentile, and expected move. A step-by-step framework for consistent profits.

Best Stocks for Credit Spreads: A 7-Step Selection Framework
In a market ruled by volatility, opportunities abound for those who know where to look. When options premiums are inflated, selling premium becomes the preferred strategy. And credit spreads sit at the center of that approach.
What if you could approach the stock market like a casino, where the odds were tilted in your favor? That is the essence of a credit spread options strategy. These trades do not rely on predicting market direction. Instead, they leverage probabilities and volatility to give you an inherent statistical edge. When volatility spikes, options premiums inflate, creating prime opportunities for sellers.
But here is the question every trader asks: what are the best stocks for credit spreads?
The answer is not a specific stock. It is a process rooted in probabilities.
Options trading allows you to make calculated decisions based on measurable odds, ensuring that you are not leaving your trades to chance. This guide will walk you through how to find stocks for credit spreads by focusing on liquidity, implied volatility, and the probability of success. With this 7-step framework, you will learn how to stack the odds in your favor, manage risk effectively, and trade with the confidence of a seasoned professional.
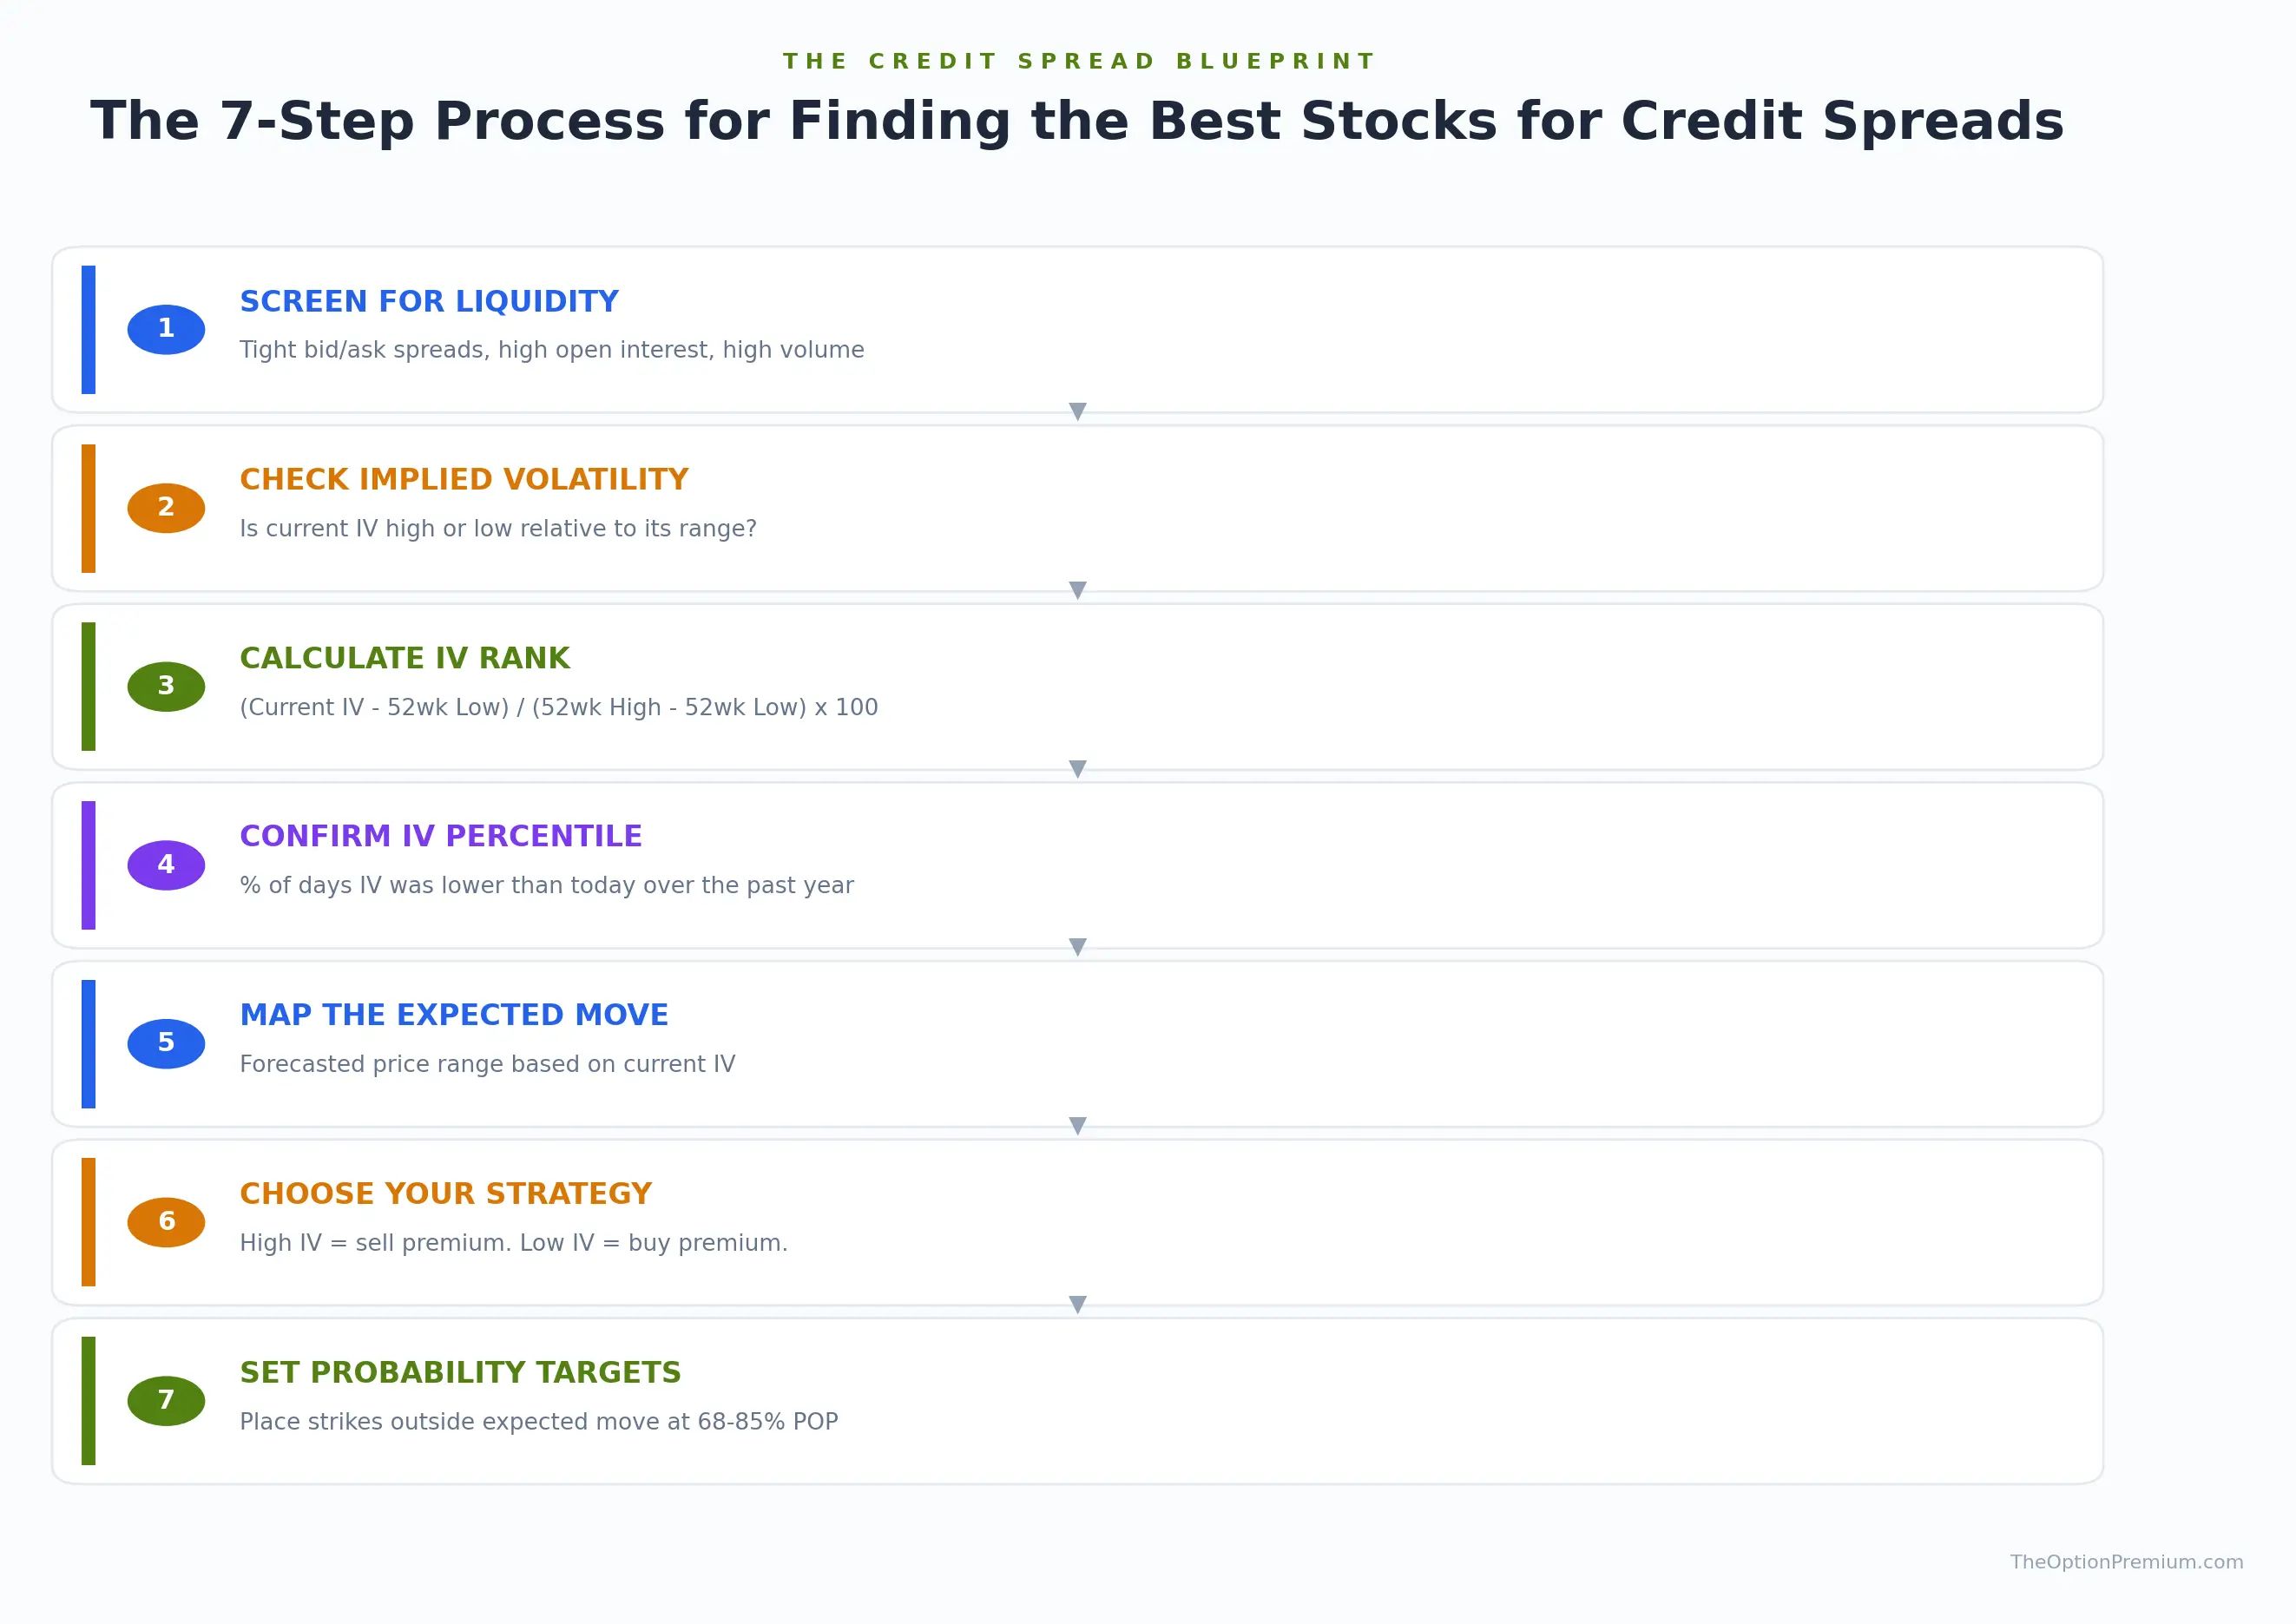
Seven step process for finding the best stocks for credit spreads from liquidity screening through probability targeting
Step 1: Screen for Options Liquidity Before Anything Else
Options trading without liquidity is like trying to sell a painting in the dark: it is inefficient and frustrating. Illiquid options are plagued by wide bid/ask spreads, which mean poor pricing at every stage of the trade, whether you are opening, adjusting, or closing.
Out of approximately 3,200 tradable stocks with options, only about 14% meet the options liquidity for credit spreads that I deem essential. That includes roughly 3% classified as highly liquid and about 11.5% with medium liquidity. Always prioritize stocks with high options liquidity to ensure efficient execution and avoid unnecessary slippage.

Donut chart showing only 14 percent of stocks with options pass the liquidity test for credit spreads
A liquid option is one that can be easily bought or sold without significantly affecting its price. Liquidity is critical because it ensures fair pricing, reduces transaction costs, and provides flexibility in entering or exiting positions. The key factors that define whether a stock qualifies among the best stocks for credit spreads from a liquidity standpoint include tight bid/ask spreads (look at names like AAPL, where the spread is often just a penny wide), high open interest indicating the number of outstanding contracts (SPY options routinely carry open interest in the tens of thousands), high trading volume reflecting active participation (QQQ options consistently rank among the most traded), proximity to current price since at-the-money options tend to be most liquid, and expiration date since shorter-term options carry more liquidity than long-dated contracts.
For the best ETFs for credit spreads, names like SPY, QQQ, IWM, and DIA consistently pass every liquidity test. Among individual equities, AAPL, MSFT, TSLA, AMZN, and META are perennial favorites because they combine the volume, open interest, and tight spreads that credit spread traders need.
The bottom line: better pricing from tight spreads minimizes slippage and transaction costs. High liquidity allows you to execute and adjust without moving the market. And liquid options reduce the risk of being unable to exit a position when you need to.
Step 2: Understand What Implied Volatility Tells You About Premium
Each stock has a unique implied volatility range, representing the expected movement in its price over the life of the option. Current IV provides a snapshot of the premium you can expect, but it does not tell the full story. Context is everything.
How does today's IV compare to the past year? That comparison helps determine whether volatility is inflated, subdued, or somewhere in between. This distinction is critical for selecting the right credit spread options strategy.
When implied volatility is high relative to its historical range, premiums are inflated. This is ideal for selling strategies like credit spreads and iron condors because you collect more premium, which widens your margin of error and increases your probability of profit.
When implied volatility is low, premiums are cheap. This environment better suits buying strategies such as long calls or puts, where you want to pay as little as possible for the options you purchase.
Understanding this relationship between IV and strategy selection is what separates traders who find the best stocks for credit spreads from those who simply pick familiar names.
Step 3: Calculate IV Rank to Measure Relative Volatility
How can you determine whether the implied volatility of a stock or ETF is actually high or low? The answer lies in a metric called IV Rank.
IV Rank is your compass for navigating implied volatility. It compares the current IV to its range over the past 12 months, expressed as a percentage.
The formula: IV Rank = 100 x (Current IV - 52-Week Low) / (52-Week High - 52-Week Low)
For example, if a stock's IV has fluctuated between 20 and 40 over the past year and its current IV is 30, the IV Rank would be 50%. This tells you that current IV sits exactly at the midpoint of its recent range.
IV rank visual showing how implied volatility rank works for selecting credit spread opportunities in the high IV zone
For selling credit spreads for income, I prefer to see an IV Rank above 50%, with ideal conditions above 67%. At these levels, you are collecting premium that is meaningfully elevated relative to what the stock has offered over the past year.
An IV Rank of 72%, for instance, tells you that current IV is in the upper third of its 52-week range. This is precisely the environment where credit spreads thrive because you are being paid handsomely to take on defined risk.
This is the difference between trading and guessing. You are not trying to predict the future. You are using available data to make decisions grounded in measurable probabilities. IV Rank is exactly that kind of data: a measurable input that replaces speculation with process.
Step 4: Confirm Your Read with IV Percentile
IV Percentile takes the analysis a step further by measuring the percentage of trading days in the past year when IV was lower than it is today.
The formula: IV Percentile = (Days IV Was Lower Than Current IV / 252 Trading Days) x 100
If a stock's IV Percentile is 70%, it means that 70% of the time over the last year, implied volatility was lower than its current level. Like IV Rank, this metric helps pinpoint when volatility is elevated and signaling prime opportunities for selling options.
I use both IV Rank and IV Percentile together because they answer slightly different questions. IV Rank tells you where current IV sits within its 52-week range. IV Percentile tells you how often IV has been lower. When both metrics are elevated, you have strong confirmation that now is a favorable time to sell credit spreads on that particular stock or ETF.
This dual confirmation process is one of the things that makes this framework reliable for finding the best stocks for credit spreads rather than relying on gut instinct or tips from a trading forum.
Step 5: Map the Expected Move to Define Your Playing Field
The expected move is the forecasted price range of a stock based on its current IV. This range, updated in real time, offers traders a valuable guide for credit spread strike selection and risk management.
For example, if Apple is trading at $234.40 and the expected move over the next 46 days shows a range of roughly $220 to $250, you can structure trades accordingly. Your goal is to ensure that your short strikes sit outside this projected range, giving the underlying stock room to move while still keeping your position profitable.
The expected move is not a guarantee. It represents a one-standard-deviation range, meaning the stock is expected to stay within that range approximately 68% of the time. By placing your strikes beyond the expected move, you increase that probability even further, often reaching the 75% to 85% probability of success zone that I target for credit spreads.
This step is where the abstract concepts of IV and probability become concrete. You are no longer guessing. You are using the market's own pricing to determine where your strikes should go.
Step 6: Choose the Right Credit Spread Strategy for the Volatility Environment
With volatility as your guide, you can select the most appropriate credit spread options strategy. High IV environments signal a seller's market, favoring strategies like vertical spreads (both bear call spreads and bull put spreads), iron condors, and covered calls. Low IV environments steer you toward buying strategies instead.
Selling strategies, particularly credit spreads, offer a statistical edge in high volatility environments for three reasons. First, inflated premiums mean you collect more credit upfront, which increases your return on risk. Second, higher IV means the expected move is wider, allowing you to place strikes further from the current price while still collecting meaningful premium. Third, elevated IV tends to revert to the mean, meaning the volatility you sold is likely to decrease, which benefits your short position.
This is the core principle behind how to find stocks for credit spreads: you are not looking for the "right" stock in isolation. You are looking for the intersection of liquidity, elevated IV, and favorable probabilities. When all three align, you have a high-quality credit spread candidate.
Step 7: Use Probabilities to Select Your Strike Prices
Quantitative trading is a game of probabilities. Once you have identified an opportunity that passes the first six steps, use probabilities to guide your strike selection.
For a bear call spread, you might select a short strike above the expected move, ensuring a credit spread probability of success above 80%. For a bull put spread, you would select a short strike below the expected move with a similar probability target.
By targeting probabilities between 68% and 85%, you position yourself to win on the majority of trades while still collecting enough premium to make the trade worthwhile. Go too far out of the money chasing 95% probabilities, and the premium collected will not justify the risk when a loss eventually occurs. Stay too close to the money at 55% or 60%, and you sacrifice the statistical edge that makes credit spreads work.
I typically aim for the 75% to 85% range, depending on the specific stock, the IV environment, and how the trade fits within my broader portfolio. This sweet spot balances premium collection with probability of success and allows the law of large numbers to work in your favor over hundreds of trades.
The goal is not certainty. Certainty does not exist in markets. The goal is odds that are sufficiently in your favor, combined with the discipline to play those odds consistently. That is exactly what this framework delivers.
Volatility: The Thread That Connects Every Step
At the core of every successful approach to finding the best stocks for credit spreads is one fundamental driver: volatility.
Volatility is not just a background metric. It actively shapes options pricing, defining the premiums you can collect and the risks you take. For credit spreads in particular, understanding volatility is not optional. It is essential.
High volatility inflates options premiums, making selling strategies like credit spreads and iron condors particularly lucrative. Low volatility favors buying strategies, offering cheaper entry points with potential for significant upside. Every step in this framework traces back to volatility: it determines your IV Rank, your IV Percentile, your expected move, your strategy selection, and your strike placement.
To succeed as an options seller, you must move beyond the notion of finding the "perfect" stock and instead focus on building a robust, methodical framework. Analyze liquidity to ensure efficient execution. Use IV Rank and IV Percentile to gauge whether premiums are worth selling. Map the expected move to define your strike placement. And set probability targets that give you a measurable, repeatable edge.
The best opportunities do not come from chasing the market or following tips. They come from disciplined decision-making, a clear understanding of volatility, and a willingness to adapt strategies to what the market offers. By mastering these principles, you can sidestep the illusions of quick wins and focus on consistent, long-term success with credit spreads.
May your spreads stay wide and your probabilities stay high,
Andy Crowder
📩 Want to see how a 24+ year professional options trader approaches the market?
Subscribe to The Option Premium, my free weekly newsletter where I share:
Probability-based strategies that actually work: credit spreads, cash-secured puts, the wheel, LEAPS, poor man's covered calls, and more
Real trade breakdowns with the math behind every decision
Market insights for any environment, whether we're grinding higher, pulling back, or chopping sideways
No hype. No predictions. Just the frameworks I've used to trade options for over two decades.
📺 Want more? Follow me on YouTube for in-depth tutorials, live trade analysis, and the kind of education you won't find anywhere else.
Connect with me:
This newsletter is for educational purposes only and should not be considered investment advice. Options trading involves significant risk and is not suitable for all investors. Past performance does not guarantee future results. Always consult with a qualified financial professional before making investment decisions.
Reply